 Busirank Team
Introduction
If you manage a multi-location business—or you’re an agency overseeing local SEO for several clients—you already know the challenge: tracking Google Maps rankings across multiple locations is not the same as tracking a single listing.
A single-location business can check its ranking from one address and get a reasonably clear picture. A multi-location brand cannot. Each location has its own Google Business Profile, its own competitive landscape, its own proximity dynamics, and its own set of ranking fluctuations.
Worse, traditional rank tracking tools often flatten this complexity into a single national average—a number that represents no individual user’s experience and tells you nothing actionable about your performance in specific markets .
The solution is a structured, location-aware tracking strategy. This means using geo-grid rank tracking for each location, organizing your data by market, and understanding the three distinct surfaces where local visibility appears: Maps results, Local Pack results, and the expanded Local Finder .
In this guide, you’ll learn exactly how to track Google Maps rankings across multiple locations—from setting up your tracking infrastructure to interpreting the data and turning insights into action.
Before we dive into tactics, it’s essential to understand why tracking multiple locations requires a different approach.
The Proximity Problem, Multiplied
Google Maps rankings are hyper-local. As Search Engine Land explains, “there are no #1 rankings in any of Google’s localized results because each unique searcher is shown customized information, largely based on the location of their device at the time of search” .
For a single-location business, this means your ranking varies by a few miles. For a multi-location business, it means every location operates in its own micro-market with distinct proximity dynamics.
National Averages Are Misleading
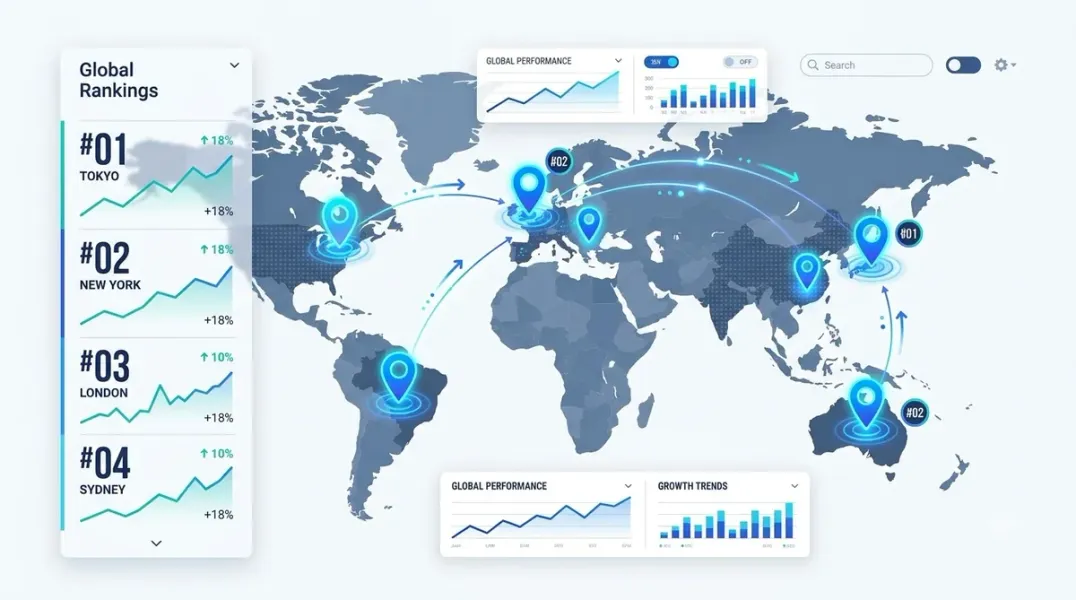
Nightwatch’s guide to multi-location SEO tracking makes this point clearly: “A national average ranking aggregates those different results into a number that represents no individual user’s experience” . If you have locations in New York, Austin, and Seattle, a single “average rank” across all three tells you almost nothing about your actual visibility in any of those markets.
Three Surfaces to Track
Multi-location tracking isn’t just about Maps. Local visibility appears across three distinct surfaces :
- Maps-based results – The default on Android devices, accessible via google.com/maps
- Local Packs – The three-business block that appears in Google Search results
- Local Finder – The expanded list reached by clicking “More places” in a Local Pack
Each surface can show different businesses in different orders. As Search Engine Land demonstrates, the first three businesses in Maps often don’t match the first three in the Local Pack . A complete tracking strategy accounts for all three.
Step 1: Set Up Location-Specific Tracking
The foundation of multi-location tracking is treating each location as its own tracking entity.
Create a Separate Tracking Profile per Location
Whether you’re using Local Falcon, BrightLocal, or another geo-grid tool, create a dedicated tracking profile for each business location. This ensures:
- Keywords are tracked from the correct geographic center
- Rankings reflect the actual proximity dynamics of that market
- Competitors are correctly identified for that location
Center Each Grid on the Actual Location
Don’t use a city center or ZIP code centroid. Use the precise latitude and longitude of each business location as the center point for your geo-grid . This ensures your heatmap reflects the real-world visibility from that storefront or service area.
Choose Location-Appropriate Grid Settings
Different locations may require different grid configurations. As Apify’s geo-grid tool documentation notes, you can set grid size (3x3, 5x5, 7x7, 9x9) and radius based on the market .
| Market Type | Recommended Grid | Recommended Radius |
|---|---|---|
| Dense urban | 7x7 or 9x9 | 1-2 miles |
| Suburban | 5x5 | 3-5 miles |
| Rural / wide service area | 5x5 | 5-10+ miles |
For a restaurant in downtown Manhattan, a 7x7 grid at 1-mile radius captures the relevant competitive landscape. For a plumber serving a 20-mile radius in rural Texas, a 5x5 grid at 5-10 miles is more appropriate.
Step 2: Organize Keywords by Location Tier
Not every keyword needs to be tracked at every location. Nightwatch recommends tiering your keyword list by commercial intent and your locations by strategic importance .
Keyword Tiers
- Tier 1 (High Intent): Track at every location, at the highest granularity (geo-grid)
- Examples: “emergency plumber [city],” “dentist near me”
- Tier 2 (Mid-Funnel): Track at city level
- Examples: “plumbing services [city],” “teeth whitening [city]”
- Tier 3 (Awareness): Track at country level
- Examples: “how to fix a leaky pipe,” “dental care tips”
Location Tiers
- Tier 1 (Top Markets): Track at ZIP code / geo-grid level
- Tier 2 (Secondary Markets): Track at city level
- Tier 3 (Other Markets): Track at country level only
This structure keeps your dataset manageable while ensuring you have granular visibility where it matters most .
Step 3: Run Geo-Grid Scans for Each Location
With your tracking profiles set up, run geo-grid scans for each location.
How Geo-Grid Scans Work
A geo-grid tool divides a geographic area into a grid of points. For each point, the tool simulates a search as if a customer were standing at that exact location, recording your ranking in the local pack .
The result is a heatmap showing where you rank high (green), moderate (yellow), and low or not at all (red).
What You’ll See Across Multiple Locations
When you run scans for multiple locations, you’ll typically find:
- Strong performance near each location: This is expected—proximity favors the closest business.
- Varying performance in surrounding areas: One location may have strong visibility 3 miles out; another may drop off after 1 mile.
- Different competitors in different markets: The businesses competing with your New York location are not the same as those competing with your Austin location.
Metrics to Capture per Location
Most geo-grid tools provide these summary metrics :
| Metric | What It Measures |
|---|---|
| Average Rank | Mean position across all grid points |
| Coverage | Percentage of points where you appear at all |
| Share of Local Voice (SoLV) | Percentage of points where you rank in top 3 |
| Top Competitors | Who dominates each point, with ratings and review counts |
Step 4: Structure Your Reporting for Clarity
The biggest risk in multi-location tracking is data overload. A dashboard showing rankings across 12 cities, 50 keywords, and multiple devices is overwhelming and rarely actionable .
Create Location-Specific Views
Structure your tracking and reporting by location cluster. Each market gets its own view with:
- Its keyword set
- Its geo-grid configuration
- Its competitor list
- Its alerts and notifications
Aggregate views that compare cross-location performance can sit at the top level, but the working views should be location-specific .
Use Run Comparisons
BrightLocal’s Local Search Grid now supports run comparisons, allowing you to compare grid performance across two dates for a specific keyword . This is invaluable for showing progress—or spotting declines—over time.
Include Competitor Intelligence
BrightLocal’s update also added the ability to see up to 20 competitors at each grid point, with their review counts and Google Business Profile links . This transforms a ranking report into a competitive intelligence document.
Step 5: Turn Multi-Location Data into Action
Raw data is useless without action. Here’s how to act on your multi-location insights.
If a Location Has Low Coverage Near Its Own Address
This is a red flag. It usually means the Google Business Profile is under-optimized. Focus on:
- Completing every GBP field
- Choosing the correct primary category
- Adding services and products with relevant keywords
- Responding to all reviews
If a Location Has Strong Local Visibility but Weak Regional Visibility
This is the proximity problem. To expand the visibility radius, strengthen prominence signals:
- Reviews: Quantity, quality, and velocity all matter
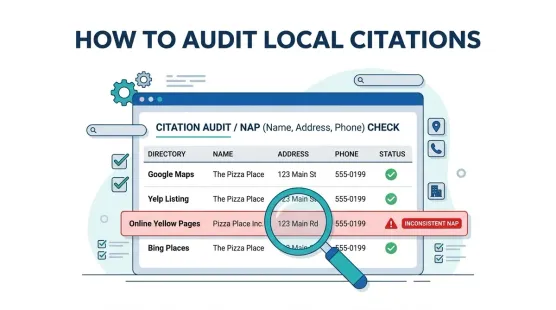
- Citations: Ensure NAP consistency across directories
- Backlinks: Local sponsorships, partnerships, and community involvement
- Content: Location-specific landing pages and blog posts
If Competitors Dominate Certain Areas
Use geo-grid data to identify where competitors are strong and where they’re weak. BrightLocal’s competitor comparison feature lets you view your grid side-by-side with a competitor’s . Focus your optimization efforts on underserved areas.
If You’re Planning Expansion
Use multi-location tracking data to assess potential new markets. If your brand has strong visibility in a neighboring city but no physical presence there, that’s a signal for expansion. Conversely, if you have a location in a market where you’re invisible, that’s a signal for investment .
Tools for Multi-Location Google Maps Tracking
Here are the leading tools for tracking rankings across multiple locations.
Local Falcon
Local Falcon is purpose-built for geo-grid rank tracking. It supports unlimited locations, white-label reporting, and multi-location tracking across brands and regions . Features include:
- Geo-grid visuals with shareable heatmaps
- Trend, campaign, keyword, and location reports
- Competitor visibility comparison
- Apple Maps and Google rank tracking in one place
BrightLocal Local Search Grid
BrightLocal’s Local Search Grid recently received a major update with competitor intelligence, run comparisons, and AI-powered insights . It supports grid sizes up to 21x21 and is priced from $31/month .
Apify Geo-Grid Trackers
Apify offers several geo-grid rank trackers as pay-per-scan actors, with no monthly subscription . This is a cost-effective option for agencies that need occasional scans or want to automate via API.
Local Rank Guru
Local Rank Guru offers a free Firefox extension for manual geo-grid scans, making it accessible for small businesses and freelancers . The extension saves results to a dashboard for review.
Conclusion
Tracking Google Maps rankings across multiple locations is fundamentally different from tracking a single listing. National averages are misleading. Proximity dynamics vary by market. Competitors differ from one location to the next.
The solution is a structured, location-aware approach:
- Set up separate tracking profiles for each location, centered on the actual business address.
- Tier your keywords and locations to keep your dataset manageable and your granularity focused where it matters.
- Run geo-grid scans for each location to see true visibility across the local market.
- Structure reporting by location, not as a single aggregated dashboard.
- Turn insights into action, whether that means optimizing an underperforming GBP, expanding visibility radius, or planning market expansion.
The bottom line: Multi-location tracking requires multi-location thinking. One number cannot represent the reality of a business operating in multiple markets. A structured geo-grid approach can.
Call to Action
Managing multiple locations and struggling to see the full picture?
Stop relying on national averages. Start tracking what actually matters.
👉 Try a geo-grid scan for each of your locations and see exactly where you’re visible—and where you’re not.
👉 Download our Multi-Location SEO Checklist for step-by-step guidance on setting up location-specific tracking, organizing keywords, and interpreting your geo-grid data.
Your customers are searching from everywhere. Make sure they find you in every market you serve.
FAQs
1. Can I track Google Maps rankings for multiple locations at once?
Yes, but not with a single grid. Each location needs its own geo-grid scan centered on its actual address. Tools like Local Falcon and BrightLocal support multi-location tracking with separate grids per location.
2. Why can’t I just use a national average to track multi-location rankings?
National averages aggregate location-specific results into a number that represents no individual user’s experience . For multi-location businesses, this hides the reality of performance in each specific market.
3. What’s the difference between tracking Google Maps rankings and Google Search rankings?
Maps-based results and Search-based results (Local Packs) are separate indexes and can show different businesses in different orders . A complete multi-location strategy tracks both.
4. How many grid points do I need for each location?
It depends on the market. For dense urban areas, use a 7x7 or 9x9 grid with a 1-2 mile radius. For suburban or rural areas, a 5x5 grid with a 3-10 mile radius is usually sufficient .
5. How often should I run multi-location geo-grid scans?
Monthly is ideal for most businesses. For competitive markets or active campaigns, weekly scans provide more granular trend data. Quarterly is sufficient for stable industries.
6. What metrics should I track for each location?
Track Average Rank, Coverage percentage, Share of Local Voice (SoLV), and top competitors for each location . These metrics together tell a complete story of local visibility.
7. Can I compare my rankings to competitors across locations?
Yes. BrightLocal’s Local Search Grid now shows up to 20 competitors at each grid point and allows side-by-side grid comparisons . Local Falcon also provides competitor visibility comparison .
8. What if one location is performing much worse than others?
Investigate three areas: GBP optimization (completeness, categories, reviews), prominence signals (citations, backlinks), and competitive density. Use geo-grid data to identify specific geographic gaps.
9. Are there free tools for multi-location tracking?
Local Rank Guru offers a free Firefox extension for manual scans . Most other tools are paid, though some offer free trials or limited free tiers.
10. How do I report multi-location rankings to clients?
Structure reports by location, not as a single aggregated number. Include geo-grid heatmaps, SoLV metrics, and competitor comparisons for each market. BrightLocal and Local Falcon both support white-label reporting.
Internal & External Links
Internal Links
- Google Business Profile vs Google Maps: What’s the Difference?
- Why Google Maps Rankings Change by Location: Understanding Local Search Grids
- Geo-Grid Rank Tracking: How to Measure Your True Local Visibility
- Local SEO Rank Tracking: Which Keywords Should Local Businesses Monitor?
- How to Find Your Competitors in the Google Local Pack
External Sources
Grow Your Google Maps Ranking on Autopilot
Stop spending hours every week manually replying to customer reviews and writing Google posts. Busirank automates your Google Business Profile to boost your local SEO rankings and turn searchers into paying clients.

 Busirank Team