 Busirank Team
Introduction
If you’ve ever checked your Google Maps ranking from your office and felt confident about your #1 position, only to discover that customers a mile away can’t find you at all, you’ve experienced the single-location illusion.
Your ranking from one spot—usually your business address—tells you almost nothing about your actual visibility across your service area. Google Maps rankings change dramatically by location. A business that ranks #1 at its storefront might rank #12 just two miles away. This isn’t a bug; it’s how Google’s proximity-based algorithm works.
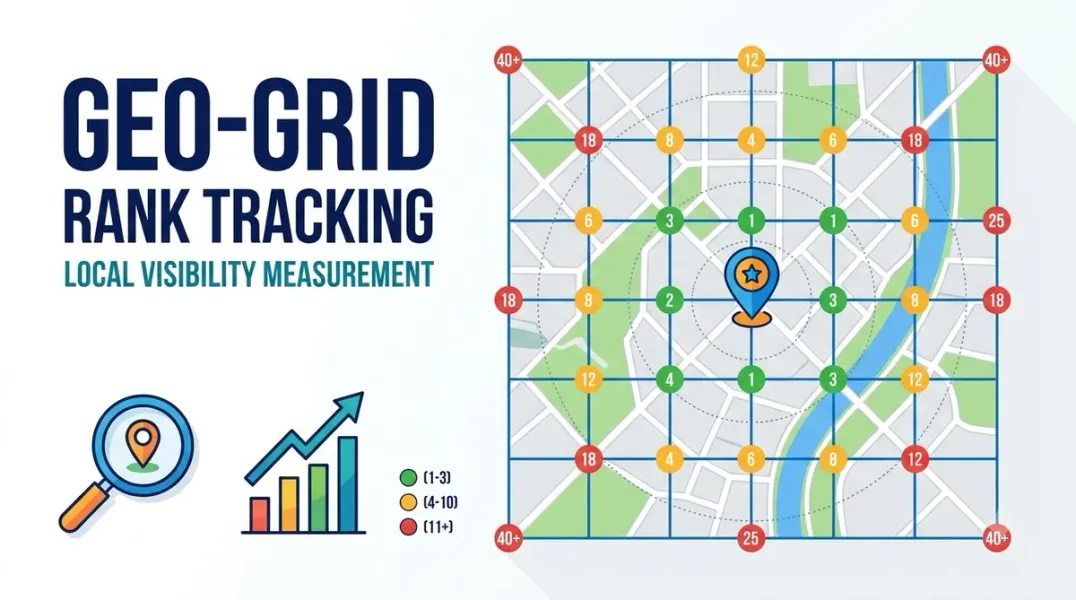
Geo-grid rank tracking is the solution. Instead of checking your ranking from a single point, a geo-grid scan measures your position from a grid of multiple geographic points across your service area. The result is a heatmap—a visual snapshot of your true local visibility.
In this guide, you’ll learn what geo-grid rank tracking is, how it works, why it matters for local SEO, how to choose the right grid settings, and how to turn raw geo-grid data into actionable optimization strategies.
Let’s dive in.
Geo-grid rank tracking is a method of measuring Google Maps rankings across multiple geographic points instead of from a single location.
Here’s how it works:
- A tool divides a geographic area into a grid of points (e.g., 5x5 = 25 points, 7x7 = 49 points).
- For each point, the tool simulates a search as if a customer were standing at that exact location.
- It records where your business ranks in the local pack for each point.
- The results are displayed as a heatmap—green for high rankings, yellow for mid-range, red for low or no visibility.
A single rank check tells you where you appear from one spot. A geo-grid tells you where you appear everywhere.
Key insight: Google names “distance” (proximity) as one of the three primary ranking factors in local search. This means the local pack can change dramatically just a few streets away. A geo-grid is the only way to see that variation.
Why a Single Rank Check Is Misleading
Most business owners check their Google Maps ranking by searching from their office or home. This creates a false sense of security.
Example: You search “coffee shop near me” from your storefront. You rank #1. You feel great.
Now imagine a potential customer searching from three miles east. From that location, five other coffee shops are closer to them than you are. You might not appear in the top 3 at all.
This is the proximity problem. Google prioritizes businesses closest to the searcher. Your ranking from your own address is the best-case scenario—and it’s rarely representative of what customers across your service area actually see.
A geo-grid scan exposes this reality. It shows you exactly where you’re visible, where you’re invisible, and where competitors are dominating.
How Geo-Grid Scans Work: A Step-by-Step Breakdown
Running a geo-grid scan is straightforward. Here’s the process:
Step 1: Choose a Geo-Grid Tool
Several platforms offer geo-grid rank tracking:
- Local Falcon – The industry standard, with AI-powered analysis and recommendations
- BrightLocal – Includes geo-grid tracking in its local SEO platform
- Rank.ai – Offers 3x3, 5x5, and 7x7 grid scans across Google Maps and organic results
- Apify Actors – Pay-per-scan options for agencies and developers
- Local Rank Guru – Free browser-based manual scans via Chrome/Firefox extensions
Step 2: Define Your Grid
You’ll need to set:
- Grid size – 3x3 (9 points), 5x5 (25 points), or 7x7 (49 points). Larger grids provide more granular data but cost more.
- Grid radius – How far the grid extends from the center point. This should match your realistic service area.
- Center point – Usually your business address, but can be customized.
Step 3: Choose Your Keywords
Select the search terms your customers actually use. Start with 3-5 core keywords. Examples:
- “plumber near me”
- “coffee shop [city name]”
- “emergency dentist [neighborhood]“
Step 4: Run the Scan
The tool simulates searches from each grid point and records your ranking. A 5x5 grid typically takes a few minutes to complete.
Step 5: Analyze the Heatmap
The results are displayed as a color-coded map:
- Green – Top 3 positions (high visibility)
- Yellow – Positions 4-10 (moderate visibility)
- Red – Position 11+ or not ranking (low/no visibility)
Step 6: Calculate Key Metrics
Most tools provide summary metrics:
- Average Rank – Your mean position across all grid points
- Share of Local Voice (SoLV) – The percentage of grid points where you rank in the top 3
- Coverage – The percentage of grid points where you appear at all
Choosing the Right Grid Size and Radius
Grid size and radius are the two most important settings. Here’s how to choose:
| Grid Size | Points | Best For |
|---|---|---|
| 3x3 | 9 | Quick checks around one address or small towns |
| 5x5 | 25 | Most businesses—neighborhoods, small cities |
| 7x7 | 49 | Wide service areas, metropolitan markets |
Radius guidelines by business type:
- Small-scale retailers – 0.5 km to 1 km radius
- Restaurants and cafes – 1-2 km radius
- Home services (plumbers, electricians) – 3-5 km radius
- Wide-area services – 5-10+ km radius
Rule of thumb: Set your radius based on how far customers realistically travel to reach you. A downtown coffee shop doesn’t need a 10-mile grid. A mobile mechanic does.
For urban areas with dense competition, use tighter spacing (100-250m between points). For rural areas, wider spacing (500m+) works better.
Key Metrics to Track
Geo-grid scans produce more than just a pretty heatmap. Here are the metrics that matter:
1. Average Rank
Your mean position across all grid points. This gives you a single number to track over time. A declining average rank signals a visibility problem, even if your ranking at your address remains stable.
2. Share of Local Voice (SoLV)
SoLV is the percentage of grid points where you rank in the top 3 positions.
- 60% SoLV – Strong market presence
- 80%+ SoLV – Local dominance
- 30% SoLV – Significant visibility gaps
This is the headline metric agencies report to clients because it directly correlates with market share.
3. Coverage Percentage
The percentage of grid points where you appear in the local pack at all (typically top 10-20). If your coverage is low, you’re invisible to a large portion of your potential customers.
4. Competitor Presence
Every geo-grid scan reveals which competitors appear at each point. This helps you identify:
- Who dominates specific neighborhoods
- Where competitors are weakest
- Which areas are “up for grabs”
Turning Geo-Grid Data Into Action
Raw data is useless without action. Here’s how to use your geo-grid insights:
If You’re Weak Near Your Own Location
This is a red flag. It usually means your Google Business Profile is under-optimized or you have a relevance problem. Focus on:
- Completing every GBP field
- Choosing the correct primary category
- Adding services and products with relevant keywords
- Responding to all reviews
If You’re Strong Nearby but Weak Farther Out
This is the proximity problem. To expand your visibility radius, you need to strengthen prominence signals:
- Get more reviews – Quantity, quality, and velocity all matter
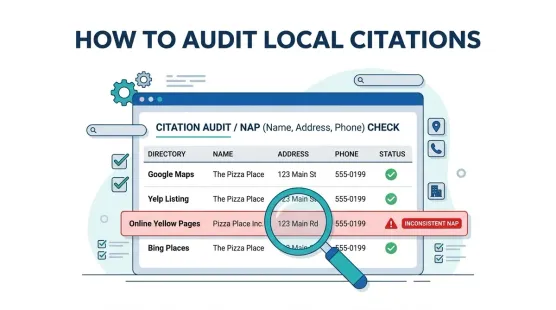
- Build local citations – Ensure NAP consistency across directories
- Earn local backlinks – Sponsorships, partnerships, community involvement
- Create location-specific content – Pages targeting surrounding areas
If Competitors Are Dominating Certain Areas
Use geo-grid data to identify where competitors are strong and where they’re weak. Focus your optimization efforts on underserved areas:
- Build citations targeted at those locations
- Encourage reviews from customers in those areas
- Create content that speaks to those neighborhoods
If You Have a Seasonal Business
Run geo-grid scans quarterly to track seasonal fluctuations. Some businesses see ranking shifts based on demand cycles. Understanding these patterns helps you allocate resources effectively.
How Often Should You Run Geo-Grid Scans?
Frequency depends on your market and goals:
| Scan Frequency | Best For |
|---|---|
| Weekly | Competitive markets, active optimization campaigns |
| Monthly | Most local businesses—balanced insight and cost |
| Quarterly | Stable industries, seasonal businesses |
Important: Keep your grid size, radius, and keywords consistent between scans. This ensures your data is comparable over time.
Common Mistakes to Avoid
- Checking rankings only from your office. This is the single-location illusion. Always use geo-grids.
- Using the same grid settings for every business. A restaurant and a plumber have different service areas. Customize your grid accordingly.
- Ignoring competitor data. Your geo-grid scan shows who’s winning where. Use that intelligence.
- Running scans without a baseline. Establish a baseline before you start optimizing. Otherwise, you can’t measure progress.
- Not acting on the data. A heatmap is a diagnostic tool, not a strategy. The value comes from what you do with the insights.
Free vs. Paid Geo-Grid Tools
Free options:
- Local Rank Guru – Free manual scans via browser extensions (Chrome/Firefox)
- Local Falcon – Free tier with 100 credits (enough for four 5x5 scans)
Paid options:
- Local Falcon – Starting at ~$24/month
- BrightLocal – Starting at ~$39/month, includes white-label reports
- Apify Actors – Pay-per-scan, from $3-4 per 1,000 grid points
For most small businesses, a paid tool is worth the investment. The insights you gain far outweigh the monthly cost.
Conclusion
A single rank check is a lie. Your Google Maps ranking from your office tells you almost nothing about your true visibility across your service area. Geo-grid rank tracking is the only way to see where you actually rank—neighborhood by neighborhood, street by street.
The process is simple: define your grid, choose your keywords, run the scan, and analyze the heatmap. The insights are powerful: you’ll see exactly where you’re winning, where you’re invisible, and where competitors are dominating.
Armed with this data, you can make smarter decisions about your local SEO strategy. Instead of guessing, you’ll know exactly where to focus your review generation efforts, which areas need more citations, and how to compete with nearby businesses.
The bottom line: You can’t manage what you don’t measure. And in local SEO, geo-grids are the measurement tool you need.
Call to Action
Ready to see your true local visibility?
Stop guessing. Start measuring.
👉 Run your first geo-grid scan with a free tool and see exactly where you rank across your service area.
👉 Download our Geo-Grid Tracking Checklist for step-by-step guidance on setting up scans, choosing keywords, and interpreting results.
Your customers are searching from everywhere. Make sure they find you—no matter where they are.
FAQs
1. What is geo-grid rank tracking?
Geo-grid rank tracking measures your Google Maps ranking from multiple geographic points instead of a single location. It produces a heatmap showing where you’re visible and where you’re not.
2. How is geo-grid tracking different from traditional rank tracking?
Traditional rank trackers check your position from one location (often your business address). Geo-grid trackers check from dozens of points across a geographic area, revealing your true visibility.
3. What grid size should I use?
Start with 5x5 (25 points) for most businesses. Use 3x3 for quick checks around one address and 7x7 for wide service areas.
4. How often should I run geo-grid scans?
Monthly works for most businesses. Weekly is better for competitive markets or active optimization campaigns. Quarterly is sufficient for stable industries.
5. What is Share of Local Voice (SoLV)?
SoLV is the percentage of grid points where your business ranks in the top 3. It’s the primary metric for measuring geographic market dominance.
6. Are geo-grid tools free?
Some are. Local Rank Guru offers free manual scans via browser extensions. Local Falcon has a free tier with 100 credits. Paid tools offer more features and automation.
7. Can I track multiple keywords in one scan?
Yes, most tools support multiple keywords. However, each keyword requires its own scan, which increases credit usage. Start with 3-5 core keywords.
8. Why do my rankings change so much across the grid?
Google uses proximity as a primary ranking factor. The closer a searcher is to your business, the higher you tend to rank. Rankings shift as the searcher’s location changes.
9. How do I improve my geo-grid performance?
Focus on prominence signals: reviews, citations, backlinks, and local content. These help you overcome proximity disadvantages and expand your visibility radius.
10. Can I use geo-grid data for client reporting?
Absolutely. Geo-grid heatmaps and metrics like SoLV and Average Rank are excellent for showing clients the real impact of your local SEO efforts.
Internal & External Links
Internal Links
- Google Business Profile vs Google Maps: What’s the Difference?
- Why Google Maps Rankings Change by Location: Understanding Local Search Grids
- How to Track Google Maps Rankings Across Multiple Locations
- Local SEO Rank Tracking: Which Keywords Should Local Businesses Monitor?
- How to Find Your Competitors in the Google Local Pack
External Sources
Grow Your Google Maps Ranking on Autopilot
Stop spending hours every week manually replying to customer reviews and writing Google posts. Busirank automates your Google Business Profile to boost your local SEO rankings and turn searchers into paying clients.

 Busirank Team