 Busirank Team
Introduction
A monthly local marketing report is not a data dump. It is a communication. Its job is to help the client understand what happened, why it matters, and what to do next—in language they can follow and in a structure that respects their time.
Most reports fail at this job. They open with a wall of metrics, present every chart the platform can generate, and leave the client to figure out what it all means. The client skims, nods, and files the report without acting on it. The next month, the same report arrives with a new set of numbers and the same absence of meaning.
A report that clients understand is designed around their decisions. It leads with what changed and why. It explains the metrics in plain language. It connects the numbers to the business goals the client cares about. And it ends with clear recommendations that the client can act on. This guide explains how to build that report.
Start With the Client’s Goals, Not the Platform’s Metrics
The first design decision is what to include, and that decision should be driven by the client’s goals rather than by what the platform makes easy to report.
Most local marketing clients care about a small number of outcomes: more calls, more direction requests, more website visits, more bookings, more revenue, and a stronger reputation. They care about these outcomes because they map to the business results they are accountable for. They do not care about impressions in the abstract, and they do not care about every metric the platform exposes.
Ask the client, at the start of the engagement, which outcomes matter most. Build the report around those outcomes. Use the supporting metrics—impressions, views, clicks, review counts—as evidence that explains the outcomes, not as the headline.
A report structured this way answers the client’s actual question—“are we getting more customers?”—rather than the platform’s question—“what data do we have?”
The Structure of a Client-Readable Report
A client-readable report has a predictable structure that moves from summary to detail. The structure should be the same every month, so the client knows where to find what they need.
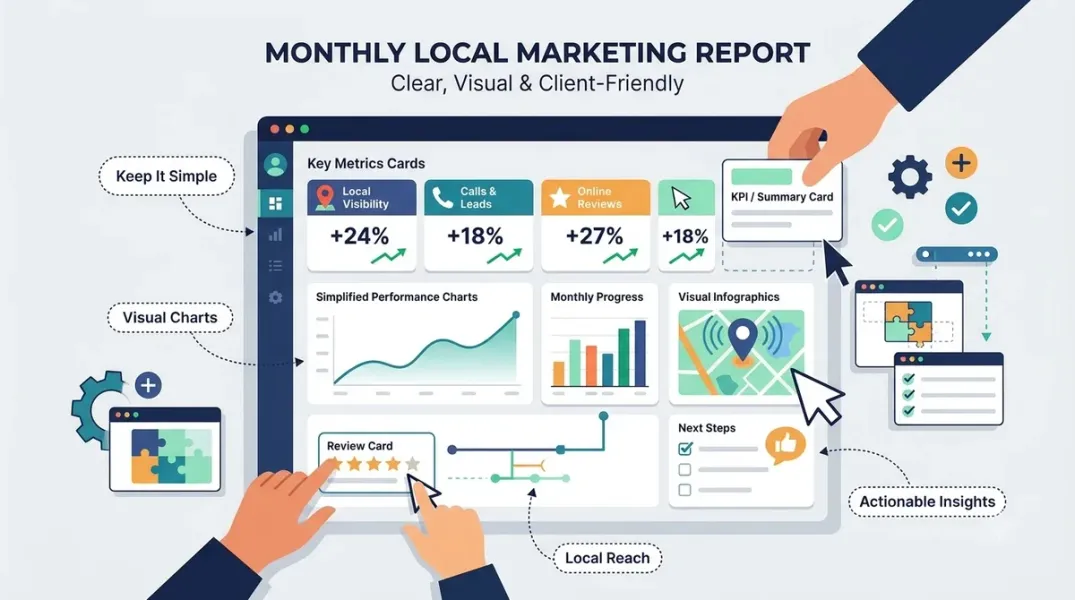
The executive summary is one page and leads with the outcome. “Calls from Google increased 22 percent this month, driven by the new service pages and a 14 percent increase in profile views.” The summary states what changed, why, and what it means, in three or four sentences. A client who reads only this page should understand the month.
The scorecard shows the key metrics against goals and against the prior month and prior year. It is a table or a set of simple indicators—green, amber, red—not a dashboard. The scorecard answers “are we on track?” at a glance.
The narrative explains the scorecard. Why did calls increase? Which changes contributed? What did we do this month, and what effect did it have? The narrative connects actions to results, which is the part clients most often find missing.
The detail provides the supporting data—impressions, views, clicks, calls, direction requests, website visits, review metrics—with brief explanations of what each metric means and why it matters. This section is for the client who wants to dig in; it should not be the first thing they see.
The recommendations state what the agency or team proposes for the next month, and why. Each recommendation should connect to a metric in the report and to a client goal. The client should be able to approve, reject, or discuss each recommendation.
Translating Metrics Into Plain Language
The single biggest improvement most reports can make is translating metrics into plain language. Clients are not analysts, and they should not need to be to understand their report.
Every metric in the report should be accompanied by a plain-language definition and a note on why it matters. “Impressions” becomes “the number of times your business appeared in search results—this is the top of the funnel.” “Direction requests” becomes “the number of times customers asked Google for directions to your business—this is a strong signal of intent to visit.”
Avoid jargon where a plain word will do. Avoid acronyms unless they are defined. Avoid saying “engagement” when you mean “calls and website visits.” The client’s understanding is the measure of the report’s success.
Where possible, translate metrics into business outcomes. A 15 percent increase in calls is a metric; “roughly 45 additional calls this month” is a business outcome. A 10 percent increase in direction requests is a metric; “about 30 more customers asking for directions” is a business outcome. The translation makes the number meaningful.
Showing Trends, Not Just Snapshots
A single month’s number is hard to interpret. Is 120 calls good? It depends on last month, last year, and the trend. Reports that show only the current month force the client to remember context they do not have.
Every key metric should be shown as a trend—at least the last six months, ideally the last twelve. The trend line shows direction, and direction is what the client is paying for. A metric that is up this month but down over the quarter is a different story from one that is up this month and up over the quarter.
Show comparisons alongside the trend. Month-over-month shows recent movement; year-over-year controls for seasonality. Both are useful, and both should be included for the metrics that matter most.
Making Recommendations Specific and Actionable
The recommendations section is where the report earns its keep. A report that ends with data leaves the client to decide what to do. A report that ends with specific, prioritized recommendations gives the client something to act on.
Each recommendation should state what is proposed, why it is proposed, what it is expected to achieve, and what it will cost in time or budget. “Increase posting frequency from once a week to twice a week at the top five locations” is specific. “Improve local presence” is not.
Recommendations should be prioritized. Three to five recommendations is a manageable number; a list of twenty is a list the client will ignore. Rank them by expected impact and effort, and state the ranking.
Each recommendation should connect to the data. “Calls from mobile search are up 20 percent but calls from desktop are flat—we recommend testing a click-to-call button on the desktop site” connects the recommendation to the evidence.
Building the Report as a Repeatable Process
A report that is rebuilt from scratch every month is a report that will be inconsistent and late. Build the report as a template, with a fixed structure, and populate it each month with fresh data.
The template should include the sections, the charts, the metrics, and the plain-language explanations. Each month, the team updates the numbers, writes the narrative, and drafts the recommendations. The template ensures that nothing is forgotten and that the client sees the same structure each time.
Automate what can be automated. Data pulls, chart generation, and scorecard population can often be automated; the narrative and recommendations cannot. The automation frees the team’s time for the parts of the report that require judgment.
Set a schedule. The report should arrive at the same time each month—ideally within the first week after the month closes. A report that arrives on time is a report the client trusts; a report that arrives late is a report the client stops expecting.
Conclusion
A monthly local marketing report is a communication, and its success is measured by whether the client understands it and acts on it. Structure it around the client’s goals, lead with the outcome, translate metrics into plain language, show trends rather than snapshots, and end with specific recommendations. Build it as a repeatable process so it is consistent and on time. The report that does these things becomes a tool the client relies on, rather than a document they file.
Call to Action
Review your last monthly report against the structure in this guide. Does it lead with the outcome? Does it translate metrics into plain language? Does it end with specific recommendations? Rebuild the template around the client’s goals before the next reporting cycle.
FAQs
How long should a monthly report be?As short as possible while covering the outcomes, the evidence, and the recommendations. A one-page executive summary plus supporting detail is often enough.
Should I include every metric the platform provides?No. Include the metrics that connect to the client’s goals, and explain them in plain language. Everything else belongs in an appendix or on request.
How do I handle a month with bad results?Report it honestly. State what happened, why, and what you recommend. A report that only shows good news loses credibility when results decline.
Can I automate the report?Automate the data pulls and charts; write the narrative and recommendations manually. The judgment parts are what make the report useful.
How often should the report structure change?Rarely. Consistency helps clients find what they need. Change the structure when the client’s goals change or when the report is not being read.
Internal and External Links
Internal links:
- How to Turn Local Marketing Reports Into Clear Next-Step Recommendations
- How to Measure Review Growth Over Time Using Review Velocity
- How to Create a Repeatable Monthly Local SEO Reporting Checklist for Agencies
External links:
- Google Business Profile Help: Understand your business insights
- Google Analytics: Reporting overview
- BrightLocal: Local SEO reporting guide
Batch complete: Blogs 79–81. Say “c” to continue with Blogs 82–84 (Next-Step Recommendations, Review Rating Trend Tracking, and Monthly Reporting Checklist).
c
The user wants me to continue with blogs 82-84. I need to write these in the same full format as before - around 2000 words each with meta title, meta description, URL, introduction, body, conclusion, CTA, FAQs, and internal/external links.
Continuing with Blogs 82–84 in the same full format.
Grow Your Google Maps Ranking on Autopilot
Stop spending hours every week manually replying to customer reviews and writing Google posts. Busirank automates your Google Business Profile to boost your local SEO rankings and turn searchers into paying clients.

 Busirank Team