 Busirank Team
Introduction
A business with 400 reviews sounds healthy. A business with 400 reviews that has not received a new one in six months is in trouble. The count tells you where the business has been. It does not tell you where it is going.
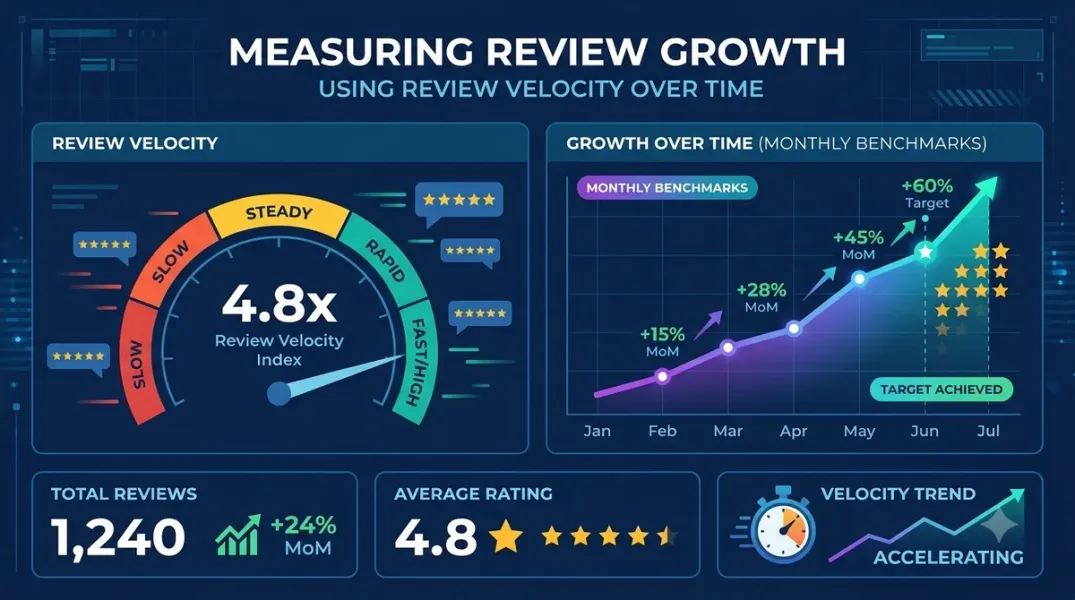
Review velocity is the rate at which a business accumulates new reviews over a defined period—typically reviews per month or reviews per week. It is the metric that turns a static count into a trend, and it answers questions that the total cannot: is review growth accelerating or stalling, how does this location compare to others, and how many reviews will we have by the end of the year if the current rate continues?
For multi-location businesses, review velocity is one of the most useful diagnostic metrics available. It surfaces problems before they show up in ratings, it benchmarks locations against each other fairly, and it supports forecasting that is grounded in actual behavior. This guide explains how to calculate it, how to interpret it, and how to use it.
Why Review Count Is a Misleading Metric
Review count is cumulative. It counts every review ever received, which means it is dominated by history. A location that was busy five years ago and quiet since can still show a high count. A newer location that is growing quickly can show a low count despite strong momentum.
Count is also not comparable across locations of different ages. A ten-year-old location and a one-year-old location cannot be judged on total reviews. The older one has had ten times as long to accumulate them.
Count also hides decline. A location that received twenty reviews a month last year and five a month this year has a count that is still growing—just more slowly. The count looks fine; the trend does not.
Velocity corrects for all three. It measures the rate, not the total, which makes it comparable across locations of different ages, sensitive to change, and useful for forecasting.
How to Calculate Review Velocity
The basic calculation is simple: the number of new reviews received in a period, divided by the number of periods. Reviews per month is the most common unit.
For a single month, velocity is simply the number of new reviews received that month. For a trend, calculate it month by month over the last twelve months and plot the result. For a smoothed view, use a rolling average—for example, the average of the last three months—to reduce month-to-month noise.
To calculate velocity from a review export, you need the review date for each review. Most review management tools and the Google Business Profile APIs expose review timestamps. Export the reviews, group by month, and count.
Three variations are worth calculating alongside the basic rate. Net velocity subtracts deleted or removed reviews from new reviews, giving the rate of net growth. Positive velocity counts only four- and five-star reviews, showing the rate at which the business is building positive social proof. Negative velocity counts one- and two-star reviews, showing the rate at which negative feedback is arriving. The ratio of positive to negative velocity is a useful quality signal.
Benchmarking Velocity Across Locations
The most valuable use of velocity is comparison. A location with a velocity of five reviews per month means little in isolation. Compared to sister locations averaging twelve, it is a signal.
Benchmark within the business first. Calculate velocity for every location over the same period, and rank them. The top quartile shows what good looks like in your own network; the bottom quartile shows where attention is needed. Because the comparison is internal, it controls for brand, category, and seasonality—the differences are attributable to location-level factors.
Benchmark against the business’s own history second. Compare each location’s current velocity to its velocity in the same period last year. This controls for seasonality and shows whether the location is improving or declining relative to itself.
External benchmarks exist—industry averages for reviews per month vary by category—but they are less actionable than internal comparisons. Use them for context, not for targets.
Using Velocity to Forecast Review Growth
Velocity supports simple, useful forecasts. If a location has received an average of eight reviews per month for the last six months, and nothing changes, it will receive roughly ninety-six reviews in the next year. That forecast is more reliable than a count-based projection because it reflects current behavior rather than historical accumulation.
Forecasts are most useful for goal-setting. If a location needs to reach 500 reviews to compete in its market and currently has 320 with a velocity of eight per month, it will reach the target in about twenty-two months at the current rate. If the goal is twelve months, velocity needs to rise to fifteen per month. The gap between current and required velocity is the size of the intervention needed.
Forecasts should be updated monthly as new data arrives. A forecast made in January and not revisited in July is a guess, not a forecast.
What Velocity Reveals About the Business
Velocity is a leading indicator. Changes in velocity often precede changes in ratings, and both often precede changes in revenue.
A location with declining velocity may have a customer experience issue that is suppressing review requests, a staff change that has reduced review solicitation, or a technical issue with the review request process. A location with rising negative velocity and stable positive velocity is receiving more complaints, which is a quality signal. A location with rising positive velocity is doing something right, and the practice is worth understanding and replicating.
Velocity also reveals the effectiveness of review generation efforts. If the business launches a review request campaign and velocity does not change, the campaign is not working. If velocity rises during the campaign and falls afterward, the campaign generated a one-time boost rather than a durable habit. If velocity rises and stays elevated, the change has been operationalized.
Common Mistakes in Velocity Analysis
Several mistakes are common enough to flag.
Calculating velocity over too short a period. A single month’s velocity is noisy. Use a rolling average or a longer window for trends.
Ignoring seasonality. Many businesses have seasonal review patterns. Compare like periods to like periods—this month to the same month last year—rather than consecutive months.
Ignoring deletions. If reviews are being removed by Google or by the business, net velocity is lower than gross velocity. Track both.
Treating velocity as a target in itself. Velocity is a means, not an end. A business that generates reviews by pressuring customers produces low-quality reviews that do not help. The goal is a healthy rate of genuine reviews, not a maximum rate.
Comparing locations without controlling for age or size. A new location and a mature location have different baseline velocities. Compare locations at similar stages, or use relative metrics.
Building a Velocity Dashboard
A velocity dashboard makes the metric usable. It should include, for each location: current month velocity, three-month rolling average, velocity for the same month last year, ranking within the network, and a twelve-month trend line.
Add the positive and negative velocity splits, and the ratio between them. Add a forecast for the next twelve months at the current rate. Add a flag for locations whose velocity has declined for three consecutive months, as these are the locations most likely to need intervention.
The dashboard should be reviewed monthly. The review questions are: which locations are declining, which are improving, and what explains the change? The answers feed into operational decisions—review request process, customer experience, staff training—rather than into a reporting exercise.
Conclusion
Review velocity converts a static count into a trend, and a trend into a diagnostic. It is comparable across locations, sensitive to change, useful for forecasting, and leading rather than lagging. Calculate it monthly, benchmark it internally, watch it for early warnings, and use it to size the interventions that review growth requires. The count tells you where you have been. Velocity tells you where you are going.
Call to Action
Export your review data for the last twelve months and calculate velocity by month for each location. Rank the locations and identify the bottom quartile. For each location in the bottom quartile, ask what is suppressing review generation—and fix it before the next quarter.
FAQs
What is a good review velocity?It depends on the category and the business’s history. Compare to your own network and to your own prior-year performance rather than to an external average.
How far back should I calculate velocity?At least twelve months to see seasonality and trend. Use a three-month rolling average for the current view.
Should I count all reviews or only positive reviews?Calculate both. Positive velocity shows social proof growth; negative velocity shows risk. The ratio is a quality signal.
How does velocity relate to ratings?Velocity is a leading indicator. Declining velocity often precedes rating changes, and both can precede revenue changes.
Can velocity be used for forecasting?Yes, for simple forecasts. Reviews per month multiplied by months ahead gives an expected count at the current rate, updated monthly as new data arrives.
Internal and External Links
Internal links:
- How to Compare Customer Sentiment Before and After a Service Improvement
- How to Prioritize Customer Reviews by Urgency Instead of Reading Them in Date Order
- How to Build Monthly Local Marketing Reports That Clients Can Understand
External links:
- Google Business Profile APIs: Reviews reference
- BrightLocal: Local Consumer Review Survey
- Google Business Profile Help: Understand your business insights
Grow Your Google Maps Ranking on Autopilot
Stop spending hours every week manually replying to customer reviews and writing Google posts. Busirank automates your Google Business Profile to boost your local SEO rankings and turn searchers into paying clients.

 Busirank Team