 Busirank Team
Page 1: Why Most Businesses Misread Their GBP Data
The Dashboard Everyone Ignores
Google Business Profile gives you a free analytics dashboard. Most businesses never open it.
Others open it once, look at a few numbers, feel vaguely reassured or vaguely worried, and close it. Very few use it to make actual decisions.
That’s a problem, because your GBP analytics is the closest thing you have to a direct readout of local customer intent. It tells you what people searched before finding you, what they did when they found you, and where the friction is between discovery and conversion.
It’s not perfect data. Google restricts some of it. Attribution is imperfect. But it’s free, it’s specific to your business, and most competitors ignore it entirely. That’s an advantage sitting unused.
Why GBP Analytics Is Different From Website Analytics
Website analytics tells you what happened after someone arrived. GBP analytics tells you what happened before—and often instead of—a website visit.
Consider the customer journey for a local business:
- Someone searches “emergency plumber near me”
- Your profile appears in the local pack
- They scan your rating, photos, and hours
- They tap “Call” without ever visiting your website Your website analytics never sees this customer. Your GBP analytics does. If you only track website traffic, you’re blind to a large share of your actual leads.
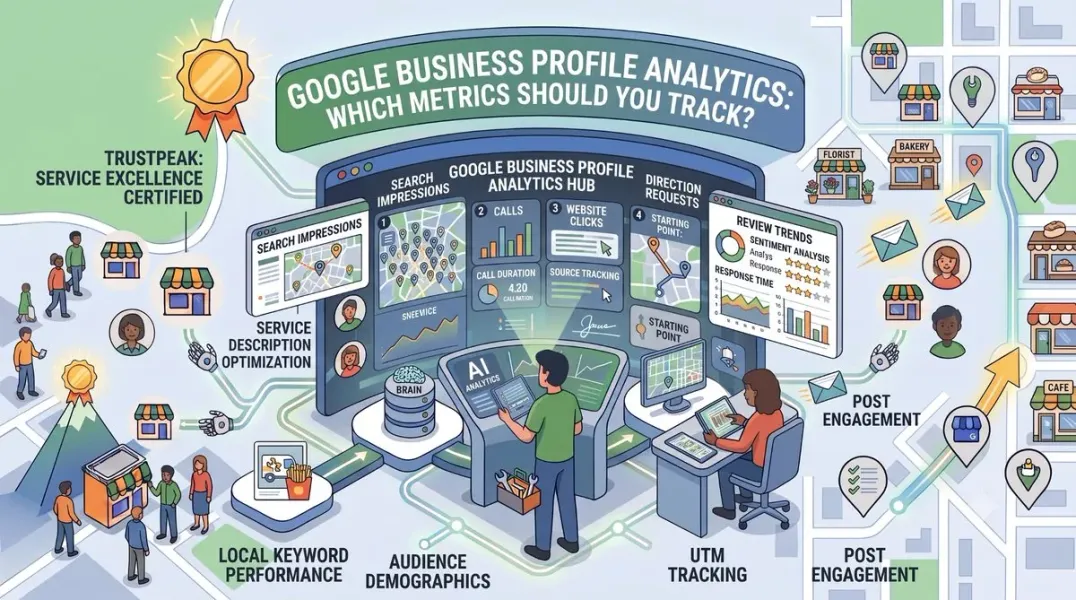
The Three Categories of GBP Metrics
Every metric in your GBP dashboard falls into one of three buckets:
1. Discovery metrics — how people found you
- Searches that showed your profile
- Views
- Discovery vs. direct searches
- Search keywords
2. Action metrics — what people did
- Calls
- Website clicks
- Direction requests
- Messages
- Bookings
- Menu views (restaurants)
3. Engagement metrics — how people interacted
- Photo views
- Photo uploads by customers
- Review activity
- Q&A activity
- Post engagement Most businesses look at action metrics and stop. The real insight comes from connecting all three: discovery tells you whether you’re visible, action tells you whether you’re converting, and engagement tells you why.
What This Guide Covers
Over the next five pages:
- Page 1: Why GBP analytics matters and how it differs from website analytics
- Page 2: Discovery metrics—searches, views, and how people find you
- Page 3: Action metrics—calls, clicks, directions, messages, and bookings
- Page 4: Engagement metrics—photos, reviews, and posts
- Page 5: Building a reporting system, benchmarks, mistakes, and conclusion
Page 2: Discovery Metrics
Searches That Showed Your Profile
This is the top-level visibility metric. It tells you how many times your profile appeared in search results.
What it includes: Google breaks this into two categories:
Discovery searches People who found you by searching a category, service, or product—not your business name. These are new customer opportunities.
Example: Someone searches “plumber near me” and your profile appears.
Direct searches People who searched your business name or a variation of it. These are people who already know you—or heard about you somewhere else.
Example: Someone searches “Joe’s Plumbing Austin” and your profile appears.
Why the split matters:
| Pattern | What It Means |
|---|---|
| High discovery, low direct | Strong new customer acquisition, weak brand recognition |
| Low discovery, high direct | Strong brand, weak visibility for category searches |
| High both | Strong overall presence |
| Low both | Visibility problem—likely profile or category issue |
What to watch: Month-over-month trend in discovery searches. If this number is flat or declining, your visibility is stagnating—even if your action metrics look fine.
Total Views
Views count how many times your profile was actually seen—not just appeared in results. This is a deeper metric than searches.
Why views matter: A profile can appear in search results without being viewed. Views tell you whether people are actually looking.
The relationship:
Views ÷ Searches = View rate
A high view rate means your listing stands out in results (good photos, strong rating). A low view rate means you’re appearing but being passed over.
Benchmark: There’s no universal target. Track your own trend monthly. If views are declining while searches are stable, something in your listing is losing appeal—likely photos, rating, or hours.
Search Keywords
Google shows you the actual search terms people used to find you. This is one of the most valuable and most overlooked sections.
What you’ll see:
- Branded terms (“Joe’s Plumbing”)
- Category terms (“plumber near me”)
- Service terms (“water heater repair”)
- Location terms (“plumber Round Rock”) How to use this data:
- Identify high-volume terms you’re appearing for. These are your strengths.
- Spot terms where you’re appearing but not converting. These reveal profile gaps.
- Find terms you should be appearing for but aren’t. These reveal category or service gaps.
- Feed successful terms into your content and services. If people search “tankless water heater installation,” make sure it’s listed as a service. Important limitation: Google only shows a sample of keywords, and exact search volumes aren’t provided. Use these as directional signals, not precise data.
Discovery vs. Direct Ratio
This ratio tells you whether your growth is coming from new customers or existing brand recognition.
Healthy pattern for a growing business: Discovery searches growing faster than direct searches. This means you’re reaching new audiences.
Warning pattern: Direct searches growing while discovery stays flat. This means you’re relying on people who already know you—which caps your growth ceiling.
Ideal long-term pattern: Both growing, with discovery consistently higher. This means brand building plus new customer acquisition.
What Discovery Metrics Don’t Tell You
- Whether views turned into visits. You need action metrics for that.
- Whether your competitors are also appearing. GBP doesn’t show competitive visibility.
- Where in the search results you appeared. You need a geo-grid tool for that. The takeaway: Discovery metrics tell you whether you’re in the game. Action metrics tell you whether you’re winning.
Discovery Metrics Checklist
- Searches tracked monthly (discovery and direct separately)
- View rate calculated (views ÷ searches)
- Search keywords reviewed and categorized
- Discovery-to-direct ratio monitored
- Trending terms fed into services and content
- Declining terms investigated for profile gaps
Page 3: Action Metrics
Why Actions Are the Metric That Matters
Discovery metrics tell you whether people see you. Action metrics tell you whether they do something about it.
For most local businesses, action metrics are the closest thing GBP offers to lead data. Every call, direction request, and website click represents a potential customer.
Calls
The single most important action metric for most service businesses.
What it measures: How many times someone tapped the call button on your profile.
Why it matters: A call is the highest-intent action available. It means someone wants to talk to you now.
What to watch:
- Monthly call volume trend
- Calls relative to views (call rate)
- Seasonal patterns
Call rate formula:
Calls ÷ Views = Call rate
A declining call rate with stable views means something in your listing is deterring action—likely reviews, photos, or pricing perception.
Important limitation: GBP call tracking counts taps, not completed calls. Some taps are accidental or abandoned. For accuracy, use a dedicated call tracking number.
Website Clicks
How many people tapped through to your website from your profile.
Why it matters: Website clicks indicate people want more information before deciding. This is a mid-funnel signal—higher intent than a view, lower than a call.
What to watch:
- Monthly click trend
- Click rate (clicks ÷ views)
- Which pages people land on (requires UTM tracking) Pro tip: Add UTM parameters to your GBP website link to see this traffic in Google Analytics:
?utm_source=google&utm_medium=gbp&utm_campaign=profile
Without UTM tags, GBP traffic gets lumped into “organic search” and becomes impossible to isolate.
Direction Requests
How many people asked Google for directions to your business.
Why it matters: Direction requests are among the strongest indicators of physical visit intent. For restaurants, retail, and businesses with storefronts, this is often the most important metric.
What to watch:
- Monthly direction request trend
- Ratio to calls and website clicks
- Seasonal and weekly patterns Benchmark note: For service-area businesses without a physical location customers visit, direction requests are less meaningful. Focus on calls and messages instead.
Messages
If you’ve enabled messaging, this counts conversations initiated through your profile.
Why it matters: Messages often come from customers who prefer text-based communication over calls. They’re also easier to track and respond to asynchronously.
What to watch:
- Message volume
- Response time
- Conversion from message to booked job Best practice: Enable messaging and respond within 15 minutes during business hours. Slow responses kill conversion.
Bookings
If you’ve integrated a booking system (Reserve with Google, OpenTable, or similar), this tracks bookings made directly from your profile.
Why it matters: Bookings are the closest metric to revenue. They represent completed conversions inside the GBP ecosystem.
What to watch:
- Monthly booking volume
- Booking rate (bookings ÷ views)
- Cancellation rate if available
Menu Views (Restaurants)
For restaurants, menu views are a critical metric.
Why it matters: Customers who view menus are significantly more likely to visit than those who don’t. This is a high-intent action.
What to watch:
- Menu views trend
- Menu views relative to total views
- Popular dishes section engagement
Putting Action Metrics Together
Individual action metrics are useful. Combining them reveals your conversion funnel.
A simple funnel:
text
Searches → Views → Actions (calls + clicks + directions + messages) → Leads
What different patterns tell you:
| Pattern | Diagnosis |
|---|---|
| High views, low actions | Listing isn’t compelling—photos, reviews, or hours |
| High actions, low conversions | Website or phone experience issue |
| High calls, low directions | Service-area business or non-visit model |
| High directions, low calls | Customers prefer walk-in—fine for retail |
| All metrics high but leads low | Lead quality or sales process issue |
Action Metrics Checklist
- Calls tracked monthly with trend
- Call rate calculated (calls ÷ views)
- Website clicks tracked with UTM parameters
- Direction requests tracked monthly
- Messages enabled and response time monitored
- Bookings integrated and tracked
- Menu views tracked (restaurants)
- Full funnel pattern reviewed monthly
Page 4: Engagement Metrics
Why Engagement Metrics Explain the “Why”
Discovery tells you if you’re visible. Actions tell you if people respond. Engagement tells you why they do or don’t.
These metrics rarely drive direct leads, but they explain patterns in the other two categories.
Photo Views
How many times people viewed photos on your profile.
Why it matters: Photos are one of the most-viewed elements on a local listing. High photo views correlate with higher engagement and conversion.
What to watch:
-
Total photo views trend
-
Views per photo (which photos perform best)
-
Customer-uploaded photos (social proof) How to use this:
-
Compare your photo views to your overall views. If photo views are high but actions are low, your photos are drawing attention but not converting—likely a quality or pricing perception issue.
-
Identify your most-viewed photos and create more like them.
-
Update photos regularly. Fresh photos get more views.
Photo Uploads by Customers
Photos uploaded by customers rather than you.
Why it matters: Customer photos are social proof. They signal that real people visit and care enough to share.
What to watch:
- Monthly customer photo uploads
- Content of customer photos (positive or negative signals) How to encourage: Mention in your review requests that customers can add photos. Many do naturally when prompted.
Review Metrics
Your GBP dashboard shows review activity, though the level of detail varies.
Key review metrics:
- Total review count
- Average rating
- New reviews in a period
- Review responses
- Response rate Why these matter: Review volume and rating directly influence both rankings and conversion. They’re covered in depth in our review management guide, but here’s the GBP-specific view:
Track monthly:
| Metric | Target |
|---|---|
| New reviews | Match or exceed competitors |
| Average rating | 4.3–4.8 |
| Review velocity | Steady, not bursty |
| Response rate | 100% |
| Response time | Under 48 hours |
Q&A Activity
Questions asked and answered on your profile.
Why it matters: Q&A appears in search results and influences conversion. An active, well-answered Q&A section builds trust.
What to watch:
- Number of questions
- Whether questions are answered
- Whether answers are upvoted
- Frequency of new questions Best practice: Seed 10–15 common questions yourself. Monitor weekly. Respond to new questions within 48 hours.
Post Engagement
How people interact with your Google Business Profile posts.
Why it matters: Posts aren’t a direct ranking factor, but they signal activity and can drive calls, clicks, and messages.
What to watch:
- Post views
- Clicks on post CTAs
- Engagement by post type (informational vs. promotional) Limitation: GBP provides limited post-level analytics. If you want deeper data, use UTM parameters on post links to track traffic in Google Analytics.
Engagement Metrics in Context
Individual engagement metrics mean little in isolation. Here’s how to interpret them together:
| Pattern | What It Suggests |
|---|---|
| High photo views, low actions | Photos attract but don’t convince—improve food/work/product photos |
| High review count, low rating | Volume without quality—investigate service issues |
| High Q&A activity, low responses | You’re being asked but not answering—respond faster |
| Low photo views, high actions | Customers make decisions from reviews alone—add photos to strengthen |
| Low engagement across the board | Profile looks stale—likely needs fresh content and posts |
Engagement Metrics Checklist
- Photo views tracked monthly
- Top-performing photos identified
- New photos uploaded monthly (2–5 minimum)
- Customer photo uploads monitored
- Review count, rating, and velocity tracked
- Response rate at 100%
- Q&A monitored and seeded
- Post engagement reviewed by type
- Engagement patterns connected to action metrics
Page 5: Building a Reporting System
Which Metrics Actually Matter (By Business Type)
Not every business should weight metrics equally.
| Business Type | Priority Metrics |
|---|---|
| Service business (SAB) | Calls, messages, website clicks |
| Restaurant | Direction requests, menu views, calls, reservations |
| Retail storefront | Direction requests, calls, website clicks |
| Medical/dental | Calls, bookings, website clicks |
| Multi-location | Per-location breakdown of all metrics |
| Emergency services | Calls (especially after-hours) |
Start with the metrics that map to your primary conversion action. Add secondary metrics as you mature.
How to read it:
- Look for trends over 3+ months, not month-to-month noise
- Investigate any metric that changes by more than 20%
- Connect changes to actions you took (new photos, more reviews, category change)
Setting Benchmarks
There’s no universal “good” number for GBP metrics. Benchmarks come from three sources:
-
Your own history. Track month over month. Improvement over your baseline is what matters.
-
Competitor comparison. Check your top three local pack competitors’ review counts, ratings, and photo counts. Match or exceed.
-
Industry patterns. Restaurants and service businesses have different baseline patterns. Don’t compare across industries.
Connecting GBP Metrics to Revenue
Raw metrics don’t justify investment. Revenue does.
The formula: GBP revenue = (Calls × Call-to-job rate × Average job value) + (Website clicks × Click-to-lead rate × Close rate × Average job value)
Example for a plumber:
- 60 calls/month
- 40% become booked jobs
- Average job = $450
- Call revenue = $10,800
- 80 website clicks/month
- 15% submit a form (12 leads)
- 35% close rate (4 jobs)
- Average job = $450
- Click revenue = $1,800
- Total GBP-attributed revenue = $12,600/month Once you know this number, you can evaluate whether the time invested in GBP optimization is worth it. For most local businesses, it is—dramatically.
Tools That Extend GBP Analytics
Native GBP analytics is limited. These tools extend it:
| Tool | Purpose |
|---|---|
| Google Analytics 4 | Track website traffic from GBP with UTM parameters |
| CallRail / WhatConverts | Attribute calls to GBP and other sources |
| Local Falcon / BrightLocal | Track geo-grid rankings and competitor visibility |
| Looker Studio | Build custom dashboards combining GBP and GA4 data |
| Podium / Birdeye | Track reviews, messages, and conversions together |
Common Analytics Mistakes
- Never opening the dashboard. The most common mistake.
- Looking only at calls. Missing clicks, directions, and messages.
- No UTM tracking. Website clicks become impossible to attribute.
- No call tracking. Can’t verify which calls came from GBP.
- Ignoring discovery metrics. Missing visibility trends until they’re a problem.
- Comparing to national benchmarks. Local metrics don’t work that way.
- Overreacting to single-month changes. Look for trends, not noise.
- Not connecting metrics to revenue. Data without business context is trivia.
- Never adjusting strategy based on data. Insights without action are wasted.
- Ignoring seasonal patterns. HVAC, landscaping, and restaurants all swing dramatically.
Quick Analytics Checklist
Setup:
-
GBP dashboard access confirmed
-
UTM parameters on GBP website link
-
Call tracking installed
-
GA4 connected and filtering GBP traffic
-
Reporting spreadsheet created Monthly review:
-
Discovery and direct searches tracked
-
Views and view rate calculated
-
Calls, clicks, directions, messages tracked
-
Review count, rating, velocity tracked
-
Photo views and engagement reviewed
-
Changes over 20% investigated
-
Metrics connected to actions taken Quarterly review:
-
Competitor benchmarks refreshed
-
Revenue attribution calculated
-
Strategy adjusted based on trends
-
Reporting format refined
A Realistic Timeline
| Timeframe | Expected Progress |
|---|---|
| Month 1 | Setup complete, baseline data captured |
| Month 2–3 | Trends visible, initial adjustments made |
| Month 4–6 | ROI measurable, strategy refined |
| Month 6–12 | Data-driven optimization cycle running |
| Year 2+ | Predictable lead patterns, defensible position |
Conclusion
Google Business Profile analytics is one of the most underused free tools in local marketing. Most businesses ignore it. The ones that use it make better decisions, faster.
The framework is simple:
- Discovery metrics tell you if you’re visible
- Action metrics tell you if people respond
- Engagement metrics tell you why Track all three. Connect them to revenue. Look for trends over months, not noise over weeks. Adjust your strategy based on what the data shows.
You don’t need advanced tools to start. The GBP dashboard, a spreadsheet, and UTM parameters will take you further than most of your competitors ever go.
Start this month. Open the dashboard. Capture the baseline. Then improve one metric at a time.
Twelve months of consistent measurement will tell you more about your local market than any competitor’s guesswork ever could.
Call to Action
Want a ready-to-use reporting system? Download our free GBP Analytics Tracking Kit, including a monthly reporting template, UTM tagging guide, revenue attribution calculator, and a KPI cheat sheet by business type. [Link to kit]
FAQs
What is Google Business Profile analytics?
It’s the free performance dashboard inside your Google Business Profile that tracks how people find and interact with your listing—including searches, views, calls, website clicks, direction requests, messages, and photo views.
Which GBP metric matters most?
It depends on your business. Service businesses should prioritize calls and messages. Restaurants should focus on direction requests, menu views, and reservations. Retail should track directions and calls. Start with the metrics that map to your primary conversion.
How do I track Google Business Profile traffic in Google Analytics?
Add UTM parameters to your GBP website link: ?utm_source=google&utm_medium=gbp&utm_campaign=profile. This isolates GBP traffic in Google Analytics so you can measure it separately from organic search.
What’s the difference between discovery and direct searches?
Discovery searches are people finding you through category, service, or product queries—not your business name. Direct searches are people searching your business name. Discovery indicates new customer reach; direct indicates brand recognition.
Why are my GBP calls not matching my actual phone calls?
GBP counts taps on the call button, not completed calls. Some taps are accidental, abandoned, or made by people who don’t complete the call. For accuracy, use a dedicated call tracking number.
How often should I check my GBP analytics?
Review key metrics weekly (calls, messages), full reporting monthly, and deeper trends quarterly. Daily monitoring isn’t necessary unless you’re in emergency services.
How do I know if my GBP is performing well?
Benchmark against three things: your own history (are metrics improving?), your top three competitors (are you matching them?), and industry patterns (are your metrics consistent with your vertical?).
Can I see what keywords people used to find my GBP?
Yes, but only a sample. Google shows search terms in your dashboard, though not comprehensive data. Use these as directional signals, not precise analytics.
What’s a good call rate for Google Business Profile?
There’s no universal benchmark. Track your own call rate (calls ÷ views) and focus on improving it over time. A declining call rate with stable views signals a listing problem.
How do I connect GBP metrics to revenue?
Use call tracking to attribute calls, UTM parameters to track website traffic, and your CRM to track lead-to-job conversion. Multiply leads by close rate and average job value to calculate GBP-attributed revenue.
Internal & External Links
Internal links: Replace these with your own URLs.
-
How to get more Google reviews External links:
Grow Your Google Maps Ranking on Autopilot
Stop spending hours every week manually replying to customer reviews and writing Google posts. Busirank automates your Google Business Profile to boost your local SEO rankings and turn searchers into paying clients.
 Busirank Team