 Busirank Team
Introduction
Most agency reports are filled with numbers that look impressive but mean nothing to the client reading them. Rankings, impressions, and visibility scores dominate the page while the client wonders one thing: is this working? The metrics that answer that question are the ones tied to customer actions—calls, direction requests, and website clicks. Everything else is context.
The data backs this up. A complete local SEO report should lead with the actions that indicate commercial engagement—calls, direction requests, website clicks, and review acquisitions—and support those numbers with the visibility and engagement data that explains them . Yet many agencies still open with profile views and work through to call clicks as an afterthought, losing the client’s attention before reaching the numbers that matter.
This guide breaks down exactly which Google Maps metrics belong in a monthly client report, which should stay in your internal dashboard, and how to frame each metric so clients understand what it means for their business.
Local SEO metrics fall into three distinct tiers, and each serves a different purpose in client reporting .
Conversion metrics are the primary tier. These include phone calls, direction requests, website clicks, form submissions, and booking completions. They directly tie to revenue and justify the investment. These should lead every report.
Engagement metrics are secondary. These include GBP actions, review responses, photo views, and post engagement. They are leading indicators that predict future conversions but do not directly generate revenue.
Visibility metrics are supporting context. These include Map Pack position, keyword rankings, impressions, and search visibility scores. They explain engagement and conversion trends but are not results in themselves.
Most reports over-index on visibility and under-index on conversions. The fix is simple: flip the ratio. Lead with conversions, use engagement to explain trends, and include visibility only as supporting context .
The Metrics That Belong in Every Client Report
Not all Google Maps data carries the same weight. Here are the metrics that should appear prominently in every monthly client report.
Phone Calls
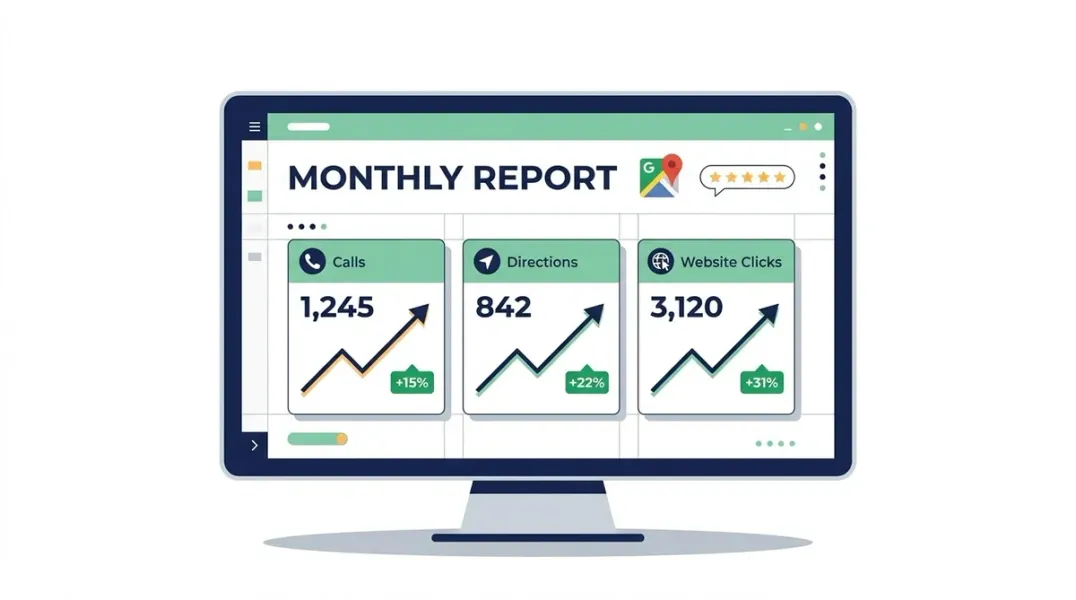
Call clicks are direct lead generation evidence. A user who taps the call button is expressing immediate buying intent. This is the single most important metric for service businesses, and it should be positioned prominently in every report .
Direction Requests
Direction requests are the clearest foot traffic intent signal available in Google Business Profile data. When someone asks for directions to a physical location, they are taking concrete action toward a visit. For storefront businesses, this metric often correlates more directly with revenue than calls do .
Website Clicks
Website clicks measure traffic driven from the Google Business Profile to the website. They are an intent signal and a proxy for landing page experience. While not as direct as calls, they indicate interest and provide a path for attribution through GA4 .
Profile Views by Discovery Type
This metric breaks down how customers found the profile. Direct searches occur when someone searches for the business by name. Discovery searches occur when someone searches for a category, product, or service, and the profile appears. Discovery search growth is typically the most meaningful signal for active optimization campaigns because it shows the business is reaching people who did not previously know it existed .
Review Count and Rating Trend
Review volume, average rating, and response rate are competitive positioning signals. Reviews influence both rankings and customer trust. Tracking these month over month shows whether the business is building or losing reputation momentum .
Local Pack Rank Movement for Priority Keywords
Rankings matter as context, not as results. Present rank movement as position change rather than absolute position, because movement communicates momentum more clearly than a static number. Focus on the 3-5 keywords that actually drive revenue, not the full list .
The Metrics That Belong in Your Internal Dashboard
Some metrics are useful for your team but should not appear in client reports. Including them adds noise and distracts from the numbers that matter.
Photo Views
Photo view count is a profile engagement quality signal. It tells you whether users are interested enough to browse the gallery before calling. Useful for your optimization decisions, but not a client priority .
All Search Queries
The full list of search queries triggering the profile is research data, not reporting data. Show the client the top 5 queries that validate targeting and reveal opportunities. Keep the complete list internal .
Maps vs. Search Impression Split
The split between Maps and Search impressions is a technical signal. Clients do not need to understand the difference. Use it internally to identify where visibility is stronger and where to focus optimization .
Photo View Comparison vs. Competitors
Competitive photo benchmarking is useful for your strategy but too granular for most client reports. Include only when photo content is a specific campaign focus.
Profile Health Metrics
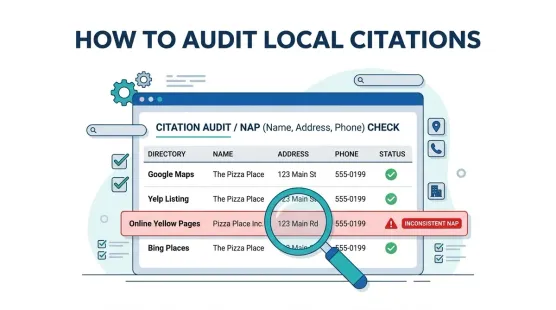
GBP completeness, category accuracy, and citation consistency are operational metrics. Track them internally and mention them in reports only when a significant change or issue needs client awareness.
How to Frame Metrics So Clients Understand
The same data lands differently depending on how you frame it. “Direction requests increased 23% this month” is abstract. “You got 34 more people asking for directions to your store this month” is concrete .
Translate Impressions Into Reach
Separate discovery impressions from direct impressions and explain what each means. Discovery impression growth demonstrates that local optimization is making the business visible to people who were not previously aware of it. That is the most direct evidence of campaign impact outside of keyword rankings .
Connect Actions to Business Outcomes
Direction requests and phone call clicks are the clearest evidence that local visibility is translating into actual business inquiries. Impressions show reach. Actions show conversion. A client who sees their monthly direction requests grow from 34 to 67 over six months understands that more people are choosing to visit their business .
Show Review Trends Alongside Rank Trends
Review velocity directly affects ranking and conversion. Show the review trend alongside the rank trend so clients see how reputation momentum connects to visibility. Businesses replying to reviews 25% of the time average 35% more revenue .
The Monthly Report Structure That Works
A complete local SEO report for agency clients should follow a clear structure that respects the client’s time .
Opening Summary
Two to three sentences stating whether local search performance improved, held, or declined relative to the previous period, with the primary driver identified.
Business Action Metrics
Call clicks, direction requests, and website clicks from GBP as the headline commercial performance section. This is what the client cares about most.
Local Visibility
Profile views by discovery type, search queries triggering the profile, and local rank position trends for target keywords.
Review Performance
New reviews in the period, current average rating, and review response rate.
Next Steps
Specific planned actions for the next period with the rationale connecting each action to a visible gap in the current data.
Multi-Location Reporting Considerations
For multi-location businesses and franchises, reporting requires both aggregate and individual views .
The franchisor or corporate office needs system-wide performance: total leads across all locations, average Map Pack position, aggregate review metrics, and overall ROI. Individual locations need their own dashboards showing how they compare to peers and where their specific opportunities are.
Use traffic light indicators (red/yellow/green) for at-a-glance performance assessment and show trends, not snapshots, month over month .
The ROI Calculation That Justifies Everything
The ultimate test of a local SEO report is whether it answers: how much revenue did this generate? To answer this, you need two numbers: leads generated from local search, and the average lead-to-customer conversion rate and customer value .
Multiply leads × conversion rate × average customer value, and you have your local SEO revenue attribution. Compare this to your monthly investment to calculate ROI.
For example: if GBP and location pages generate 40 calls and 15 form submissions per month (55 leads), with a 25% close rate and $500 average customer value, the program generates approximately $6,875/month in revenue. If the investment is $1,500/month, that is a 4.6x ROI .
Conclusion
The metrics that matter in a Google Maps client report are the ones tied to customer actions. Calls, direction requests, and website clicks are the headline numbers. Profile views, discovery searches, and review trends provide context. Rankings are supporting data, not results.
Lead with conversions. Frame metrics in business outcomes, not technical jargon. Show trends, not snapshots. And always connect the data back to revenue.
The agencies that master this reporting approach build trust, retain clients longer, and justify their value with numbers that business owners actually understand.
Call to Action
Ready to build reports your clients actually read? Start by restructuring your next monthly report to lead with calls, direction requests, and website clicks. Then add the context that explains those numbers.
Download our Local SEO Client Report Template for a proven structure that connects metrics to revenue. Or contact our team to audit your current reporting and identify what to keep, what to cut, and what to add.
FAQs
Which Google Maps metrics should I report to clients every month?
Lead with phone calls, direction requests, and website clicks—these are the action metrics tied to revenue. Include profile views by discovery type, review count and rating trends, and local pack rank movement as supporting context. Keep photo views, full query lists, and impression splits in your internal dashboard .
Why shouldn’t I include all keyword rankings in client reports?
Clients do not need 200 keywords. Focus on the 3-5 “money keywords” that drive revenue. Show position changes for those, not a comprehensive list. Rankings are context, not results .
How do I explain direction requests to clients?
Frame it concretely: “You got 34 more people asking for directions to your store this month.” Direction requests are the clearest foot traffic intent signal. They show people are ready to visit .
What’s the difference between discovery searches and direct searches?
Direct searches occur when someone searches for your business by name. Discovery searches occur when someone searches for a category or service and your profile appears. Discovery search growth is the more meaningful signal for active campaigns because it shows you are reaching new potential customers .
How do I calculate ROI for a local SEO report?
Use the formula: Leads × Close Rate × Average Customer Value = Attributed Revenue. Then compare attributed revenue to your monthly investment. For example, 55 leads × 25% close rate × $500 average value = $6,875 in attributed revenue. If the investment is $1,500, that is a 4.6x ROI .
Internal & External Links
Internal Links
- How to Connect Local SEO Metrics With Actual Sales (Topic 71)
- Local SEO Attribution: How to Know Which Searches Generate Customers (Topic 72)
- How to Create a Local SEO Dashboard for Business Owners (Topic 73)
- How to Compare Local SEO Performance Month Over Month (Topic 75)
External Sources
- Google Business Profile Help: Understand your Business Profile performance: https://support.google.com/business/answer/9918094
- Google Analytics Integration with Business Profile: https://ppc.land/google-analytics-links-business-profiles-to-report-local-metrics/
- Locafy: Local SEO Reporting—What to Track and How to Show ROI: https://locafy.com/blog/local-seo-reporting
- Agency Dashboard: Google My Business Reporting—Proving Local SEO Value: https://agencydashboard.io/blog/google-my-business-reporting-agencies
Grow Your Google Maps Ranking on Autopilot
Stop spending hours every week manually replying to customer reviews and writing Google posts. Busirank automates your Google Business Profile to boost your local SEO rankings and turn searchers into paying clients.

 Busirank Team