 Busirank Team
Local Advertising Break-Even Analysis: A Small Business Guide
Learn how to calculate the break-even point for local advertising campaigns using margin, CAC, and LTV—with formulas, worked examples, and industry benchmarks.
/blog/local-advertising-break-even-analysis
Introduction
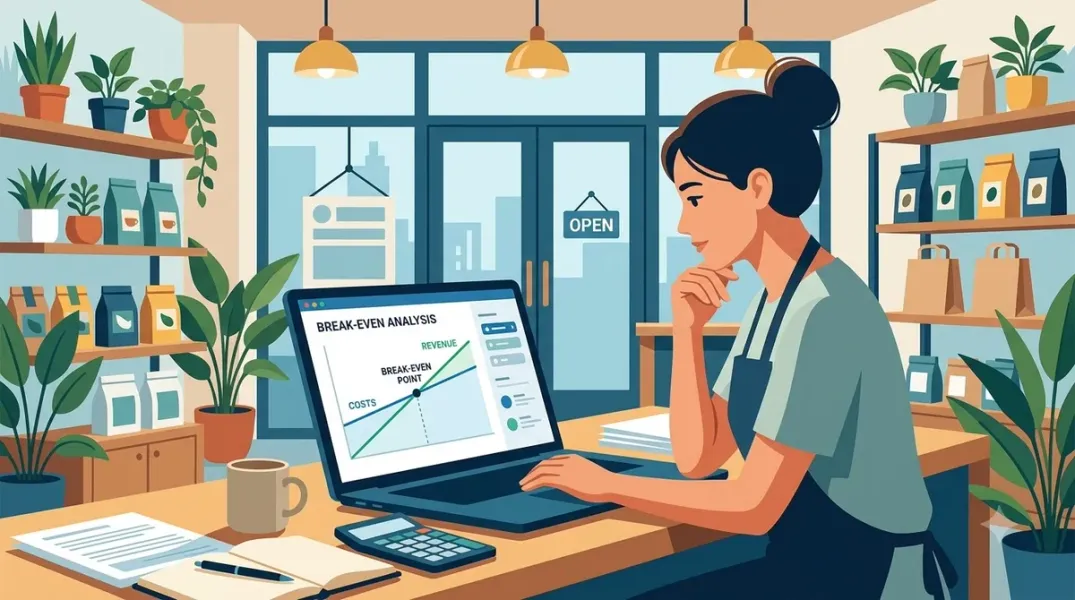
Most local advertising decisions are made in the wrong direction. A business owner looks at a campaign’s return on ad spend, sees a number that seems impressive, and scales it. Or sees a number that seems weak and cuts it. Both decisions are made without answering the only question that actually matters: At what point does this campaign stop losing money and start making it?
That threshold is the break-even point. For local businesses, it is not a single number that applies across every campaign. It depends on your profit margin, your cost to acquire a customer, and whether you are willing to wait for repeat purchases to recover the spend. A campaign that breaks even on the first order looks very different from one that breaks even over twelve months of customer value.
This guide explains how to calculate the break-even point for local advertising campaigns. You will learn the core formulas, how to apply the LTV-to-CAC framework, what the benchmarks look like across common local channels, and how to use the result to bid more aggressively—or walk away—with confidence.
1. Start With the One Formula That Prevents Most Mistakes
The simplest and most useful break-even calculation for any advertising campaign is break-even ROAS, and it depends on a single input: your gross margin.
Break-Even ROAS = 1 ÷ Gross Margin %
A 30% margin requires a 3.33x ROAS just to break even on the media spend, before accounting for overhead, creative costs, or management time. A 25% margin requires 4x. A 60% margin can break even at 2.5x.
The reason this formula matters is that most local businesses celebrate revenue multiples without checking profitability. A “3x ROAS” sounds healthy—until you realize that at a 30% margin, it is still a losing campaign.
Worked example: A local home services business has a 35% gross margin. Its break-even ROAS is 1 ÷ 0.35 = 2.86x. Any campaign below 2.86x is losing money on the media spend alone.
Fix: Calculate your break-even ROAS before evaluating any campaign. Compare reported ROAS against this floor, not against an arbitrary target inherited from a blog post or an agency deck.
2. Separate the Question Into Two Break-Even Points
The single ROAS target most businesses use is a blunt instrument. A more useful framework separates break-even into two distinct questions:
- What ROAS do I need from the first order alone to break even on the media spend?
- What ROAS can I accept on the first order if I project repeat purchases and recover the acquisition cost over a longer window?
These two numbers are usually very different. Understanding the gap between them is where most local businesses find their competitive edge—and where most leave growth on the table by capping campaigns at an arbitrary target that ignores lifetime value.
First-order break-even is the conservative floor. LTV-adjusted break-even is the aggressive ceiling. Most campaigns should be evaluated against the second, but only if you have a realistic model for repeat purchases.
3. Calculate Your First-Order Break-Even Point
The first-order break-even point tells you the minimum revenue each new customer must generate to cover the cost of acquiring them, given your margin.
Break-Even First-Order Revenue = CAC ÷ Gross Margin %
Where CAC (Cost to Acquire a Customer) = Total Campaign Spend ÷ New Customers Acquired.
Worked example: A local cleaning company spends $2,000 on a Google Ads campaign and acquires 20 new customers.
CAC = 100**
If the company’s gross margin is 40%, the break-even first-order revenue is:
250**
That means each new customer must generate at least $250 in revenue on their first booking for the campaign to break even on a first-order basis. If the average first cleaning is $150, the campaign is losing money on the first order—unless repeat business closes the gap.
4. Calculate Your LTV-Adjusted Break-Even Point
The LTV-adjusted approach asks a different question: if you are willing to recover acquisition cost over a defined window—typically 12 months—how low can first-order ROAS be while still hitting your target?
The calculation runs in three steps.
Step 1: Calculate 12-month LTV.
12M LTV = Average Order Value (AOV) × Purchase Frequency × Gross Margin %
Step 2: Determine Allowable CAC based on your target LTV:CAC ratio. A 3:1 ratio is the widely cited healthy benchmark for small businesses; 3:1 to 4:1 is a practical target for most local businesses with repeat purchases and low churn.
Allowable CAC = 12M LTV ÷ Target LTV:CAC Ratio
Step 3: Calculate Payback-Adjusted Acquisition ROAS.
Acquisition ROAS Target = CAC ÷ (AOV × Gross Margin %)
Worked example: A local pet supply store has an AOV of $45, a purchase frequency of 8 times per year, and a 35% gross margin.
12M LTV = 126**
At a 3:1 target, Allowable CAC = 42**
Acquisition ROAS Target = 45 × 0.35) = $42 ÷ $15.75 = 2.67x
The store can acquire customers at a first-order ROAS of 2.67x and still hit a 3:1 LTV:CAC ratio over twelve months. If the margin were higher or the purchase frequency stronger, the acceptable first-order ROAS could fall below 1x—meaning the first order does not even cover its own acquisition cost, but the customer is still profitable over time.
Fix: Use first-order break-even as your hard floor and LTV-adjusted break-even as your bidding ceiling. The gap between them is the room you have to compete for customers.
5. Know the Benchmarks—But Do Not Import Them
Industry benchmarks are useful reference points, not targets. The variation across channels and verticals is wide enough that a single benchmark can be actively misleading if applied without context.
HVAC Local Services Ads (LSA) benchmarks (2025, 602 advertisers):
| Performance tier | ROAS |
|---|---|
| Bottom quartile | 1.96x |
| Median | 6.90x |
| Top quartile | 15.62x |
Source: SearchLight HVAC & Plumbing Advertising Benchmarks
A below-2x ROAS in HVAC LSA often indicates operational problems—missed calls, weak review presence, poor dispute handling—rather than weak demand. Top-quartile advertisers excel operationally as much as they do in marketing execution.
Meta Ads benchmarks for local businesses:
| Industry | ROAS range |
|---|---|
| Home services | 3–6x over 30 days |
| Contracting/remodeling | 4–8x over 12 months |
| Food and beverage | 1.5–3x on direct attribution |
| Beauty | 2–4x first visit; 5–8x including 6-month LTV |
| Professional services | 3–10x |
Source: Allora Media local Meta benchmarks
Google Ads and Facebook averages: Google Ads has been reported at an average ROAS of roughly 4.2x, Facebook at roughly 3.4x in comparable local campaign analyses.
The critical caveat is the same across every benchmark: ROAS is meaningless without LTV context. A 2x ROAS on a $50 average transaction is far weaker than a 2x ROAS on a $5,000 service. Always interpret ROAS in the context of customer value and margin.
6. Calculate Break-Even Customers, Not Just Revenue
Sometimes the clearest way to frame a local campaign is in customers, not revenue multiples. The formula is direct:
Break-Even Customers = Ad Spend ÷ Profit Per Customer
If a campaign costs $1,500 and the profit per customer is $10, the campaign needs 150 customers to break even. For a quick-serve restaurant, that might mean roughly five extra burgers a day—a concrete target that is easier to evaluate than an abstract ROAS figure.
Worked example: A local café runs a $1,200 monthly ad campaign. With a profit per customer of $8, the break-even point is 150 customers—about five per day. If the campaign consistently delivers more than five incremental customers per day, it is profitable. If it delivers fewer, it is not.
Fix: For high-volume, low-ticket local businesses, calculate break-even in customers per day or per week. It makes the target tangible for the team and easier to track in real time.
7. Factor In the Costs That Most Calculations Miss
The break-even formulas above use media spend as the primary cost input. Real campaigns carry additional costs that can move the break-even point materially.
Costs that must be included in a true break-even calculation:
- Ad creative production (photography, video, copywriting).
- Landing page development and maintenance.
- Management time—yours or an agency’s.
- Payment processing fees.
- Attribution windows that overstate performance. Most platforms use 7-day or 28-day windows that credit ads for conversions that would have happened anyway. This inflates perceived ROI and leads to overspending.
Fix: Build a “fully loaded CAC” that includes media, creative, tools, and a realistic estimate of management time. Use the fully loaded figure in the break-even formula, not the media spend alone. The result will be less flattering—and far more trustworthy.
8. Set a Payback Window You Can Actually Finance
Break-even over twelve months is not the same as break-even over thirty days. A campaign can be profitable on paper over a year while starving the business of cash in the first quarter.
CAC payback period measures how long it takes for a new customer to generate enough gross profit to cover their acquisition cost.
For most small businesses, a payback period under six months is ideal, and six to twelve months is acceptable but requires careful cash flow management. A payback period over twelve months is difficult to sustain and often signals inefficient acquisition.
Fix: Set your payback window based on your available working capital. If you cannot finance a twelve-month payback, use a shorter window in your break-even calculation—even if the LTV model would support a longer one. Profitability on paper does not pay this month’s bills.
9. Use the Break-Even Number to Make the Budget Decision
A break-even calculation is only useful if it changes a decision. Here is how to apply it.
If actual ROAS is below first-order break-even: The campaign is losing money on a first-order basis. Either the campaign needs to improve—better targeting, a stronger offer, a higher-converting landing page—or the margin needs to increase, or the campaign should be paused.
If actual ROAS is between first-order break-even and LTV-adjusted break-even: The campaign is profitable only if repeat purchases materialize. Verify that your retention and repeat-purchase assumptions are realistic before scaling. A campaign that depends on repeat business but serves one-time buyers is a losing campaign in disguise.
If actual ROAS is above LTV-adjusted break-even: The campaign is profitable on a first-order basis and has margin for repeat-value upside. This is where you can bid more aggressively than competitors who are capped at an arbitrary target.
Fix: Set two thresholds for every campaign: a hard floor (first-order break-even) and a growth ceiling (LTV-adjusted break-even). Manage campaigns between those two numbers based on cash flow and confidence in repeat behavior.
10. Recalculate When the Inputs Change
Break-even is not a fixed number. It moves when prices change, margins shift, response rates improve or decline, and customer behavior changes.
Inputs that require a recalculation:
- Average order value or service price.
- Gross margin (supplier costs, labor costs, discounts).
- Purchase frequency or retention rate.
- Cost per lead or cost per acquisition.
- Campaign creative or landing page changes.
- Attribution window changes.
Fix: Review break-even calculations quarterly, and immediately after any significant change to pricing, costs, or campaign structure. A campaign that was comfortably profitable at a 40% margin may be underwater at 30%.
Conclusion
The break-even point for local advertising is not a single number. It is a range bounded by two questions: what must the first order generate to cover its own acquisition cost, and how much can the first order lose if repeat purchases will recover the spend over time. The first is your floor. The second is your ceiling.
By calculating break-even ROAS from margin, building a fully loaded CAC, separating first-order and LTV-adjusted break-even, accounting for payback window and hidden costs, and using benchmarks as reference points rather than targets, local businesses can stop guessing whether a campaign is working—and start knowing exactly how much they can afford to spend to grow.
The businesses that win at local advertising are not the ones with the highest ROAS. They are the ones that know their number—and bid accordingly.
Call to Action
Do you know your break-even point? Start with the simplest calculation: divide 1 by your gross margin to get your break-even ROAS. Then check whether your current campaigns are above or below it. If you want help building a fully loaded break-even model for your local campaigns—including LTV, payback window, and channel-level thresholds—contact us for a free break-even analysis and get a clear number to bid against.
FAQs
Q1: What is the break-even point for a local advertising campaign?A: It is the point at which a campaign’s revenue covers its costs—neither profit nor loss. For local campaigns, it is usually expressed as break-even ROAS, break-even CAC, or break-even customers.
Q2: What is the simplest break-even ROAS formula?A: Break-Even ROAS = 1 ÷ Gross Margin %. A 30% margin requires 3.33x ROAS; a 40% margin requires 2.5x; a 25% margin requires 4x.
Q3: Should I use first-order ROAS or LTV-based ROAS to judge a campaign?A: Use both. First-order break-even is your hard floor—below it, the campaign loses money on every customer. LTV-adjusted break-even is your growth ceiling—it accounts for repeat purchases and can justify a lower first-order ROAS if your retention assumptions are realistic.
Q4: What is a good CAC payback period for a local business?A: Under six months is ideal. Six to twelve months is acceptable but requires careful cash flow management. Over twelve months is difficult to sustain and often signals inefficient acquisition.
Q5: Why do benchmarks differ so much between sources?A: Benchmarks vary by channel, vertical, margin structure, and attribution method. A 6.9x median for HVAC LSA and a 3–6x range for Meta home services are not contradictory—they reflect different media, different buying behavior, and different measurement windows. Use benchmarks as reference points and calculate your own break-even from your own numbers.
Grow Your Google Maps Ranking on Autopilot
Stop spending hours every week manually replying to customer reviews and writing Google posts. Busirank automates your Google Business Profile to boost your local SEO rankings and turn searchers into paying clients.

 Busirank Team