 Busirank Team
Introduction
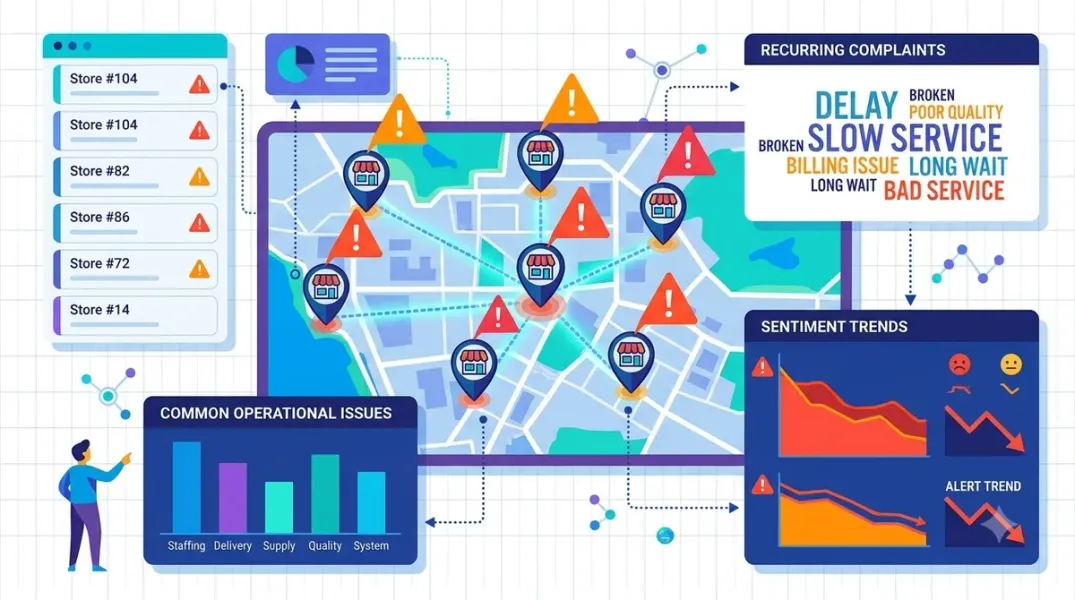
A single complaint about slow service at Store 14 is a data point. The same complaint showing up at six stores in the same region is a systemic problem — a training gap, a supply chain issue, a policy that does not work in practice — and it is invisible to anyone looking at one location at a time.
That is the structural weakness of location-by-location review management. Each store manager sees their own complaints and treats them as local. District and regional leaders see a dashboard of averages, and averages hide repeated patterns by design: one store at 3.2 stars and four at 4.6 can average out to a number that looks acceptable while the 3.2 store quietly loses customers every week.
Customer feedback analysis software exists to close that gap — to read reviews across every location, extract the themes customers actually mention, and surface the ones that repeat across the network rather than staying trapped in individual profiles. This guide covers the workflow, the tools that do it in 2026, and the measurement discipline that turns a theme list into an operational fix.
Why Averages and Single-Store Reviews Both Fail
The first problem is the rating. Two locations can both sit at 4.1 stars and have opposite stories: one where customers love the staff and complain about pricing, another where pricing is fine and the service is slow. The same number requires two different interventions, and a group average hides both.
The second problem is volume. A multi-location business with 1,200 reviews across six branches cannot be read manually. One branch generates wait-time complaints, another generates parking complaints, and the reviews that matter most — the repeated ones — are buried under hundreds of positive comments about a named employee.
The third problem is attribution. When a complaint repeats, the instinct is to ask “which store is failing?” The more useful question is “is this a store problem or a brand problem?” A complaint limited to one location is an operational issue with that location. The same complaint across several locations in a short window is a process, product, or policy issue that no single store manager can fix.
Build a Topic Taxonomy Before You Run Any Analysis
The single most important step is defining what you are counting before the tool counts it. A generic sentiment score will not tell you that “waffle fries” is the problem; a taxonomy will.
The practitioner approach is to define six to eight theme families, identical for every location, and read a sample of reviews first to see what words customers actually use — not an invented list decided in a conference room. The standard families across most local categories are staff, wait time, product or service quality, environment, price, and facilities, with category-specific themes like parking for retail or booking for clinics. The taxonomy should be multi-label, because one review can complain about wait time and parking and staff attitude in the same paragraph.
A workable multi-location taxonomy:
- Staff — attitude, knowledge, responsiveness, named employees.
- Wait time — queue, delay, appointment lag, callback delay.
- Product / service quality — the core thing you sold.
- Facilities — cleanliness, parking, accessibility, condition.
- Price — value perception, surprise fees, transparency.
- Resolution — how a problem was handled after it was raised.
Alchemer’s platform applies the same analytical model across every location and channel, which reduces the subjectivity that comes from manual tagging or regional interpretation and makes cross-location comparison meaningful. That consistency is the precondition for identifying repetition: if Store A codes “slow” as wait time and Store B codes it as staff, the pattern never surfaces.
The Three-Layer Comparison That Finds Repetition
Once the taxonomy is stable, repetition becomes visible through a three-layer comparison, which mirrors the hierarchy Birdeye’s Athena uses: business level, sentiment level, and location level.
Layer 1 — Theme frequency across the whole network. Which themes appear most often in negative reviews across all locations? Alchemer’s published example shows the pattern clearly: complaints about new waffle fries appeared at several locations, along with food order errors and missing items and poor service with incorrect or delayed orders — 177 reviews, a 2.9 average, and a pattern that manual monitoring would have read as isolated incidents.
Layer 2 — Theme concentration by location. Which locations own the highest share of a given theme? Athena’s pizza-crust example is the cleanest illustration: if sentiment around “pizza crust” is negative, the next question is which locations mention it most, so management knows where to go to fix it. After a change is made, trend analysis shows whether negative mentions for that theme decline.
Layer 3 — Theme trend over time. Is the theme rising, flat, or falling? A theme that is flat but high is chronic; a theme that is rising is a regression and needs faster attention. Alchemer’s Signals allows plain-language queries like “What changed after a recent operational update?” and returns themes, key drivers, and supporting quotes, which is the fastest way to connect a process change to a complaint trend.
Separate the Systemic From the Isolated — and Act Differently
The output of the three layers is a classification, and each class gets a different response.
Systemic themes appear across multiple locations, often in the same region or after the same operational change. These are the highest-value findings because they cannot be fixed locally. The Paris Baguette case study is the model: across 300+ franchise cafés in the US and Canada, the operations team used AI-powered review signals and sentiment analysis to identify patterns showing up across multiple locations that manual monitoring would have missed. The results were a brand rating increase from 4.2 to 4.4, 98% listings accuracy, and 146,000+ pieces of feedback collected in five years — five times the volume of the prior five years.
Location-specific themes are concentrated at one or a few branches. These are operational issues for the store manager, and the dashboard’s job is to route the finding to the person who can act on it rather than escalate it to brand leadership.
One-off mentions are noise. A theme mentioned once or twice is not a pattern, and the tool should be configured to suppress it. Apify’s Review Weakness Intelligence exposes a minimum mentions per theme setting, defaulting to two, explicitly to filter out one-off noise.
The classification discipline is what prevents two opposite failures: over-reacting to a single angry review and under-reacting to a pattern because no single review looked alarming.
The Tools That Do This in 2026
The market has split into conversational platforms, scheduled digests, and pay-per-analysis API actors, and the right choice depends on whether you need a dashboard, an alert, or a one-off audit.
Conversational and platform tools. AskNicely’s Ask NiceAI (April 2026) is built for multi-location service businesses and lets managers ask plain-language questions — “what are customers complaining about most?” — with cited answers, visuals, and recommended actions, explicitly targeting the problem of repeated complaints that take too long to spot through manual reporting. Alchemer Pulse Ai and Signals apply one analytical model across locations to compare performance, separate isolated issues from systemic problems, and identify outliers; Alchemer’s Signals answers questions like “Why is sentiment lower in one region than others?” with themes and supporting quotes. Birdeye’s Athena adds a Business Alert feature that detects themes and notifies leadership of trending issues — the example given is a Cincinnati car rental location receiving a surge of complaints about dirty cars, triggering an alert to the location manager.
Scheduled digests. Apify’s Review Roll-up monitors Google reviews across many locations in one scheduled run and produces a single digest with alert levels (none / info / warning / critical), per-location rating movement, and recurring complaint keywords in new negative reviews across the group. It is built for the specific job of spotting repetition without a full platform subscription, priced from $150 per 1,000 digests with no per-seat or minimum-location fees.
Pay-per-analysis actors. Review Weakness Intelligence scrapes Google Maps (and optionally Trustpilot) reviews and outputs themed complaint categories with sentiment and example quotes, priced from $3.00 per 1,000 result items. Review Sentiment Analyzer — Themes, Trends & Complaints turns any review set into themes, complaints, sentiment percentages, and trends. These are the lowest-cost entry points for a one-off audit before committing to a platform.
Operational dashboards. ThumbsUp tracks feedback across branches and shifts, identifies top-performing and underperforming locations, and reviews historical trends. HappyOrNot Insights turns feedback data into a monthly narrative of operational performance, explaining what changed and where attention is needed rather than presenting another dashboard. Avelle pulls and scores review sentiment for every store in one live view and flags a location’s sentiment trend before its rating drops.
The Workflow and the Measurement Rule
The workflow that produces reliable repetition findings:
- Lock the taxonomy — six to eight theme families, multi-label, identical across locations.
- Pull 60–90 days of reviews from every location, retaining review ID, location, date, rating, text, and owner response.
- Run theme extraction and compare across the three layers — network frequency, location concentration, time trend.
- Classify each theme as systemic, location-specific, or noise, and suppress themes below the minimum mention threshold.
- Route the finding to an owner — brand operations for systemic, store manager for local.
- Track whether the fix changes the evidence. This is the step most teams skip: after an operational change, re-run the same analysis on the following period and confirm the theme declines. Athena’s trend analysis exists specifically for this check, and Prepyr’s method explicitly ranks recurring recent themes and tracks whether an operational change alters later evidence.
The measurement rule that makes this credible: report theme counts alongside rating counts, and never report an average without its distribution and review volume. A theme mentioned 22 times in 60 days across three stores is a finding. A theme mentioned twice is not, and the tool should be configured to say so.
Conclusion
Identifying repeated customer complaints across multiple locations is a taxonomy-and-comparison problem, not a reading problem. The tools can now extract themes, rank them by frequency, compare them across locations, and alert leadership when a pattern emerges — but they only produce a usable answer if the theme families are defined once, applied consistently, and compared across the network rather than one store at a time.
The 2026 evidence is consistent on what this looks like in practice. Paris Baguette moved from disconnected reviews and surveys to a centralized system across 300+ cafés, found patterns across locations that manual monitoring would have missed, and lifted its brand rating from 4.2 to 4.4. Alchemer’s published example surfaces waffle-fry complaints, order errors, and delayed service across multiple locations in a single structured view. And the digest tools now deliver recurring complaint keywords across a whole group for a fraction of per-location pricing.
The remaining discipline is yours: separate systemic from isolated, route each to the right owner, and check whether the fix actually moved the theme. A theme that stops repeating is the only proof the analysis worked.
Call to Action
Run a 60-day theme audit across your locations this week. Export reviews from every store, define six to eight theme families, and code a sample by hand before letting a tool do it — that sample is your accuracy check. Then run the set through a digest tool or a platform with theme extraction, and build a simple table: theme, total mentions, number of locations where it appears, and trend direction. Anything that appears at three or more locations is a systemic candidate; anything concentrated at one is a store ticket. Assign one owner to each systemic theme and re-run the audit in 30 days to see whether the mentions fell.
FAQs
What is customer feedback analysis software?It is software that collects customer feedback from reviews, surveys, and social channels, extracts the themes customers mention, scores sentiment for each theme, and compares results across locations and time. It differs from basic review monitoring by turning unstructured comments into structured, comparable categories rather than presenting a list of individual reviews.
How do I find complaints that repeat across multiple store locations?Define a consistent theme taxonomy (staff, wait time, quality, facilities, price, resolution), extract themes from reviews across every location, and compare three layers: network frequency, location concentration, and time trend. Themes that appear at three or more locations are systemic candidates; themes concentrated at one location are local operational tickets.
What is the difference between a systemic complaint and an isolated one?A systemic complaint appears across multiple locations, often in the same region or after the same operational change, and cannot be fixed by a single store manager. An isolated complaint is concentrated at one branch and is the store’s responsibility. The same complaint appearing at six locations is a process, product, or policy issue; the same complaint at one location is an operational issue.
What tools surface repeated complaints across locations in 2026?Platforms include AskNicely Ask NiceAI (conversational feedback queries with cited answers), Alchemer Pulse Ai and Signals (theme comparison and systemic-versus-isolated separation), and Birdeye Athena (theme hierarchy, business alerts, and trend analysis). Scheduled digest tools include Apify Review Roll-up, which reports recurring complaint keywords across a group of locations. Pay-per-analysis actors like Review Weakness Intelligence output themed complaint categories with sentiment and quotes.
How many mentions make a complaint theme worth acting on?Two mentions is the common noise floor — tools like Review Weakness Intelligence default to a minimum of two mentions before reporting a theme, specifically to filter out one-offs. For action, a theme needs enough volume to be measurable and a location concentration that points to where the fix belongs. A theme mentioned 20+ times across three stores is a clear systemic finding; a theme mentioned twice is not.
Can I measure whether a fix actually reduced the complaints?Yes, and you should. Re-run the same theme analysis on the period after the operational change and compare mention counts and sentiment. Athena’s trend analysis is built for this check, and Prepyr’s method explicitly tracks whether an operational change alters later evidence. A theme that stops repeating is the proof the intervention worked.
What is the biggest mistake in multi-location complaint analysis?Reading stores one at a time and reacting to the latest review instead of the overall pattern. A single angry review gets attention while a theme that repeats across six locations goes unnoticed. The second biggest mistake is inconsistent tagging across locations, which makes cross-location comparison meaningless before the analysis even starts.
Internal & External Links
Internal links (to other posts in this series):
- How to Use Review Sentiment Analysis to Discover Customer Pain Points (previous post)
- How to Build a Google Review Monitoring Workflow for Busy Teams (next in series)
- How to Compare Local Marketing Performance Across Different Business Branches
- How to Manage Google Reviews From Multiple Locations in One Dashboard
- How to Create a Review Escalation Process for Unhappy Customers
- Best Google Business Profile Management Software for Small Businesses in 2026
External links (sources referenced in this article):
- AskNicely Launches Ask NiceAI® (IT Brief Ireland, April 2026): https://itbrief.ie/story/asknicely-launches-ask-niceai-for-service-businesses
- Apify — Review Roll-up: Multi-Location Review Digest: https://apify.com/moganes/review-rollup
- Alchemer — 6 ways Alchemer brings AI-powered customer intelligence to multi-location brands: https://www.alchemer.com/resources/blog/6-ways-alchemer-fuels-ai-powered-customer-intelligence/
- Birdeye — Athena: Insights and competitor analysis tool: https://birdeye.com/blog/competitor-analysis-tool-birdeye/
- Apify — Review Weakness Intelligence: https://apify.com/apium/review-weakness-intelligence
- Prepyr — How to analyze Google reviews and find the issues customers mention most: https://prepyr.com/blogs/analyze-google-reviews-and-find-common-customer-issues
- Calton — Analisi delle recensioni: temi e sentiment sede per sede: https://www.calton.io/blog/analisi-recensioni-temi-sentiment-per-sede
- Alchemer — How Paris Baguette turns customer feedback into operational action across 300+ franchise locations: https://www.alchemer.com/resources/case-study/how-paris-baguette-turns-customer-feedback-into-operational-action-across-300-franchise-locations/
- MetricsCart — AI Review Analysis: How AI Reads Customer Reviews Across Every Retailer: https://metricscart.com/insights/ai-review-analysis/
- ThumbsUp Dashboard App (App Store): https://apps.apple.com
- HappyOrNot — Insights: A clearer way to understand customer feedback: https://www.happy-or-not.com
- Avelle — Review intelligence across every location, in one view: https://avellesolutions.com
- Apify — Review Sentiment Analyzer: Themes, Trends & Complaints: https://apify.com
How to Build a Google Review Monitoring Workflow for Busy Teams
Grow Your Google Maps Ranking on Autopilot
Stop spending hours every week manually replying to customer reviews and writing Google posts. Busirank automates your Google Business Profile to boost your local SEO rankings and turn searchers into paying clients.
 Busirank Team