 Busirank Team
Introduction
A system-wide marketing report is an exercise in comfortable deception. Total leads are up, average cost per lead is down, and the dashboard is green. Meanwhile, three branches are quietly failing, and the flagship location is subsidizing them in every average. The report is accurate and useless at the same time.
The uncomfortable data point that defines the problem: standard platform tracking can miss up to 80% of in-store conversions for businesses with physical locations. The channels report what happens online. The revenue happens offline. And when a multi-location brand tries to compare branches using the only data it has, it ends up comparing noise.
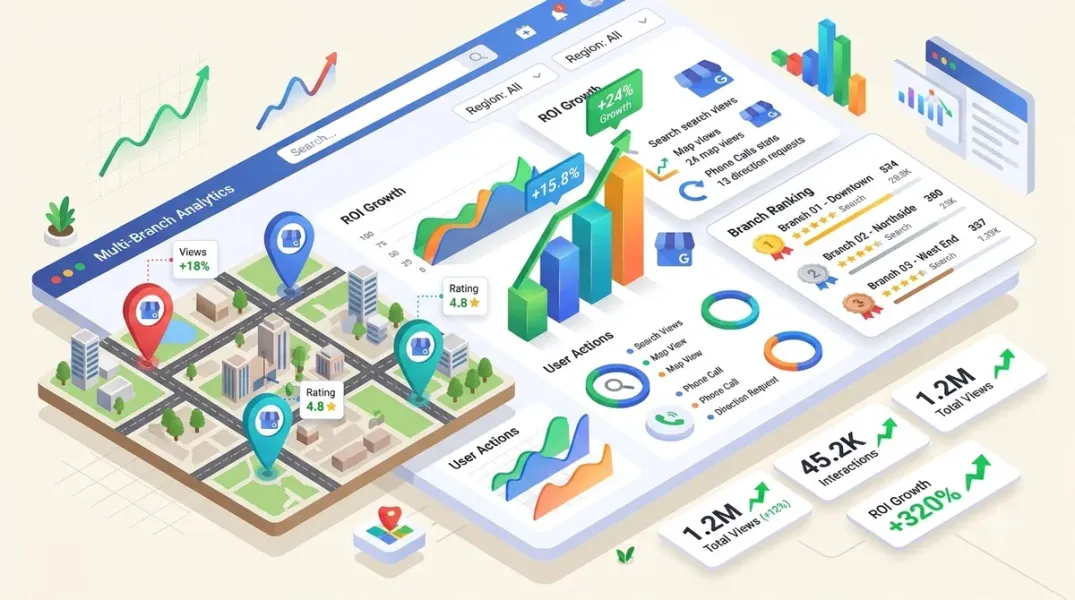
Multi-location marketing analytics exists to close that gap. It is the discipline of measuring performance at the location level—not the brand level—and comparing branches fairly enough that the comparison produces a decision. The goal is not a prettier dashboard. It is knowing which branch needs coaching, which needs budget, and which needs an operational fix that no marketing campaign can solve.
This guide covers the metrics that matter at the location level, the fair-comparison framework, the attribution problem that standard tools do not solve, the platforms that are built for this, and the reporting cadence that turns a spreadsheet into an operating rhythm.
Why Brand-Level Metrics Hide the Branches That Need Help
A multi-location marketing report has two jobs, and most reports only do one. The roll-up shows leadership whether the brand is growing. The comparison shows which stores lead, which lag, and why. The roll-up is easy. The comparison is where the decisions live, and it is the job most reports skip.
The failure mode is structural. Ad platforms organize data by campaign name, not by location. To see how one specific store is doing, a team has to reverse-engineer the data—exporting CSVs, tagging rows with location IDs, and hoping nothing gets sorted into oblivion. The result is that the brand-level number becomes the only number anyone trusts, and it masks exactly the locations that need attention.
Ignite Visibility’s 2026 blindspots report names the consequence: top-line success masks location-level failure, and the warning signs—reporting gaps, inconsistent local execution, unexplained performance differences—raise acquisition costs and squeeze margins across the entire system. A struggling location does not just underperform. It consumes budget that a healthy location could have used, and the brand-level report never shows the transfer.
The Metrics That Belong at the Location Level
The metrics that matter at the branch level are the ones that connect marketing activity to local revenue, not the ones that make a dashboard look busy.
Cost per lead (CPL) by location is the starting diagnostic. If one shop generates calls at $30 each and another at $85, that gap is a finding, not a rounding error. But CPL alone is insufficient: local teams flag 40% of digital leads as uncontactable, out of market, or automated spam, and a “great” CPL can create false confidence while the leads themselves are junk.
Lead-to-close rate by location is the metric that corrects for that. A branch with a low CPL and a low close rate is not efficient; it is generating volume that does not convert. A branch with a higher CPL and a strong close rate may be the better investment.
Revenue and margin by location are the metrics that actually matter to unit-level economics. The better benchmark than CPL is the lifetime-value-to-customer-acquisition-cost ratio, with a common target of roughly 3:1—every $1 spent on acquisition returning at least $3 in lifetime value. A branch below that line is not a marketing problem. It is a business problem that marketing cannot solve alone.
Store visit and direction request attribution is the offline bridge. Standard platform tracking misses most in-store conversions, which is why location-aware measurement matters: closed-loop attribution tools connect ad impressions to POS transactions, and location intelligence platforms turn real-world visitation into an activation and measurement signal.
Review response rate and average rating by location belong in the comparison because they are leading indicators of local trust. 89% of consumers expect business owners to respond to reviews, and a branch that ignores its reviews is telling every prospective customer that nobody is paying attention.
Posting completion by location is the compliance metric. It tells you whether a branch is running the calendar at all, which is the precondition for every other performance metric being comparable.
The Fair-Comparison Framework
The comparison that produces decisions follows four rules, and the first one is the one most reports get wrong.
Rule 1 — Compare rates, not totals. Totals reward size. A flagship with 20,000 followers will always produce more engagements than a suburban store with 2,000. A worked example makes the point: the flagship generates 300 engagements on 15,000 reach for a 2.0% engagement rate, while the suburban store generates 90 engagements on 1,800 reach for a 5.0% rate. The totals say the flagship wins. The rate says the suburban store’s content is working more than twice as hard.
Rule 2 — Compare each store against its own rolling baseline. The question a store manager can act on is not “are you beating the flagship?” It is “are you better or worse than you usually are?” A three-month rolling baseline turns the comparison from a ranking into a coaching tool.
Rule 3 — Compare within peer cohorts. Group stores that should perform alike: flagship, metro, and regional is a simple start, or follower band, store format, or market. A newly opened branch, a mature storefront, and a service-area operation have legitimate differences that raw totals cannot explain.
Rule 4 — Report scale and efficiency separately. A flagship can lead on reach and trail on engagement rate. Both facts matter, and blending them into one score hides both.
The scorecard that operationalizes this is deliberately simple: score each store 1 to 3 on four or five metrics against its peer-group median—3 for above the median by a clear margin, 2 for around it, 1 for below—and add the scores. Avoid weighting schemes nobody can explain at a store meeting. If a regional manager cannot tell a store owner why they scored 9 out of 15, the scorecard has failed.
The Attribution Problem Standard Tools Cannot Solve
The most expensive comparison error is treating a click as a customer. Google defines the Business Profile Calls metric as clicks on the call button, not answered or qualified calls. The Views metric concerns profile viewers with deduplication rules, not every exposure to the business. A click-to-view ratio is not a booked-customer conversion rate.
The data on what is actually happening offline is stark: 38% of B2B marketing pipeline is completely unattributable through standard tracking, and standard platform tracking can miss up to 80% of in-store conversions. 72% of franchise systems allocate 40%+ of marketing budget to local SEO, yet only a fraction can attribute local SEO performance to individual location revenue.
The response is not to give up on attribution. It is to build the measurement that connects activity to outcomes. Multi-touch attribution adoption reached 47% in 2026, up from 31% in 2023, and marketing mix modeling tripled to 26% as teams run two models in parallel—MTA for tactical channel decisions and MMM for strategic budget allocation. AI-powered attribution improves accuracy by 22 percentage points over deterministic models in holdout testing, and franchises that centralized their data analytics grew up to 74% faster than fragmented networks.
The practical setup for a branch comparison includes a stable internal location ID across every export. Public names, tracking lines, and page URLs change; the physical branch remains the same. Record the profile, destination page, telephone route, and CRM assignment associated with that ID during the reporting period. This small reconciliation prevents a renamed location or forwarded number from appearing to create a sudden improvement that is really a change in ownership of the records.
A qualification definition applied consistently across locations is equally essential. An accepted inquiry might require a new customer, a supported service, an address within the service boundary, and a contact the team can pursue. Keep existing customers, duplicate contacts, and unresolved inquiries separately identifiable, and do not force one branch’s class of work into another branch’s rule.
The Tools That Are Built for This
The platform landscape splits into local marketing suites, reporting-first tools, and location intelligence platforms. The right choice depends on whether the gap is execution, reporting, or offline attribution.
Local marketing and reputation suites. Birdeye combines review generation, unified messaging, and feedback analytics for multi-location businesses, starting around $250/month, with enterprise integrations and autonomous or approval-based review responses. Yext approaches the problem from listings and digital presence first, syncing business data across 200+ publishers and connecting reviews with structured location data and local pages; pricing is custom. Chatmeter is an AI-powered multi-location intelligence platform with listings management, review monitoring, social mentions, surveys, and competitive benchmarking across locations, positioned as a top alternative to Birdeye for multi-location brand management and local SEO.
Revenue intelligence and closed-loop attribution. Rallio (from Ignite Visibility) has expanded from social media management into a comprehensive local marketing and revenue intelligence platform, connecting social, reviews, listings, local SEO, paid media, and CRM outcomes back to campaigns, locations, and markets. Its review response agent generated responses to more than 493,000 reviews, saving an estimated 8,218 hours of manual work. AdMax Local’s Franchise Management Portal unifies reporting into a single source of truth with real-time KPIs like ROAS and lead generation across all locations, plus AI-driven campaign auditing that flags keyword cannibalization across locations and recommends improvements.
Reporting-first platforms for agencies. AgencyAnalytics provides roll-up reporting and dashboards that aggregate performance from up to 50 locations into one view, drill-down to individual store performance without rebuilding reports, and 85+ integrations including Google Business Profile insights and local SEO rankings. Pricing starts at $25/month. TapClicks is built for enterprise-scale operations with brand → region → owner → location hierarchy, data normalization, and AI agents that surface anomalies and benchmarks.
Location intelligence and offline attribution. Northbeam supports multi-dashboard setups per storefront or region, and its reporting design matches how the team talks about the business rather than a single national view. RevenueCloudFX tracks performance by location, channel, and ROI in one system. Triadex connects ad impressions to POS transactions for multi-location brands with 50+ locations, delivering closed-loop attribution and ROAS reporting. BigGeo’s Audience Composer turns real-world visitation into audiences that can be activated and measured online, transforming location data from a reporting tool into an activation lever.
The performance signal worth keeping in view: Google Business Profile leads outperform most paid channels for multi-location businesses. Invoca’s analysis of over 70 million phone calls found GBP ranks second only to ChatGPT referrals, with nearly half of GBP calls qualified and a 42% conversion rate—comparable to top paid channels. A branch comparison that ignores GBP is ignoring the channel most likely to be producing its best leads.
The Reporting Cadence and the Stakeholder Map
The comparison only works if it reaches the right people in the right form. The structure that holds up is three reports, not one: head office, region, and store. Each report ends with one decision—a budget shift, a coaching priority, or a content change—rather than a data dump.
The cadence is monthly reporting, quarterly review, with the store peer cohorts re-grouped once a year. The monthly report carries the location scorecard; the quarterly review is where the cohort definition and the metric dictionary get challenged, because a comparison framework that never gets audited drifts into a ranking.
The metric dictionary is the governance artifact that makes the whole system credible. Write down the seven to ten metrics once, with formulas and denominators, and never quietly redefine them mid-year. A branch comparison is only as good as the consistency of its definitions.
Conclusion
Comparing local marketing performance across branches is not a dashboard problem. It is a measurement-definition problem followed by a fair-comparison problem. The brand-level average is not wrong; it is simply answering a different question than the one that drives local decisions.
The framework that works has four parts: compare rates against each store’s own baseline and peer cohort, connect marketing activity to local revenue rather than clicks, reconcile records against a stable location ID, and deliver three reports with one decision each on a monthly cadence. The data behind it is unambiguous: standard tracking misses up to 80% of in-store conversions, CPL alone cannot tell you whether a branch is above or below the 3:1 LTV:CAC line, and centralized analytics correlates with up to 74% faster growth than fragmented networks.
The tools now support every layer—roll-up reporting, location intelligence, closed-loop attribution, and AI-driven campaign auditing across locations. The remaining discipline is defining the metrics once, applying them consistently, and using the comparison to send a coaching note rather than a scoreboard.
Call to Action
Build the metric dictionary and the peer cohorts before you build another report. Write down the seven to ten metrics you will compare across branches, with the formula and the denominator for each. Define the cohorts—flagship, metro, regional, or whatever segmentation reflects how your branches actually operate—and assign every location to one. Then pull one month of data and score each store 1 to 3 against its peer median on four metrics. Pick the single lowest-scoring store and the single highest-scoring store, and write one sentence for each explaining why. If you cannot explain the why, the metric is wrong or the cohort is wrong, and the comparison is not ready to drive a decision. Run it for one quarter before expanding the scorecard, and keep the same definitions for the full quarter—consistency is the only thing that makes a comparison defensible.
FAQs
What is multi-location marketing analytics?It is the practice of measuring marketing performance at the individual location level and comparing branches fairly, rather than reporting only brand-level averages. It connects local marketing activity—search, reviews, social, paid—to location-level outcomes like calls, direction requests, leads, conversion, and revenue.
Why do brand-level marketing metrics hide underperforming locations?Because averages mask distribution. A system-wide average can look healthy while several branches are declining, and the struggling locations consume budget that healthy locations could use. Top-line success masks location-level failure, and the warning signs—reporting gaps, inconsistent execution, unexplained performance differences—raise acquisition costs across the entire system.
What metrics should I compare across business branches?At minimum: cost per lead by location, lead-to-close rate by location, revenue and margin by location, store visit and direction request attribution, review response rate, and posting completion. Track CPL as a diagnostic, not a scoreboard—the better benchmark is the lifetime-value-to-customer-acquisition-cost ratio, with a common target of roughly 3:1.
How do I compare branches of different sizes fairly?Four rules: compare rates, not totals; compare each store against its own rolling three-month baseline; compare within peer cohorts (flagship, metro, regional); and report scale and efficiency separately. A flagship can lead on reach and trail on engagement rate—both facts matter, and blending them into one score hides both.
Why is attribution harder for multi-location businesses?Standard platform tracking was built for single-location, online businesses. It can miss up to 80% of in-store conversions, and 38% of B2B marketing pipeline is completely unattributable through standard methods. The fix is a combination of multi-touch attribution (47% adoption in 2026) and marketing mix modeling (26% adoption), plus a stable internal location ID to reconcile records across renames and routing changes.
What tools are built for multi-location marketing analytics?AgencyAnalytics (roll-up reporting for up to 50 locations, from 250/month), Chatmeter (listings, reviews, competitive benchmarking), Rallio (revenue intelligence and closed-loop attribution), AdMax Local (real-time ROAS and lead gen by location), and Triadex (POS-attributed closed-loop ROAS) are among the platforms built for this.
What is the right reporting cadence for multi-location marketing?Monthly reporting, quarterly review, with peer cohorts re-grouped once a year. Send three reports, not one—head office, region, and store—and end each with one decision. The monthly report carries the scorecard; the quarterly review is where the metric dictionary and cohort definitions get audited.
Which channel often produces the best leads for multi-location businesses?Google Business Profile. Invoca’s analysis of over 70 million phone calls found GBP ranks second only to ChatGPT referrals and outperforms every paid channel, with nearly half of GBP calls qualified and a 42% conversion rate. A branch comparison that omits GBP is omitting the channel most likely to be producing its best leads.
Internal & External Links
Internal links (to other posts in this series):
- How to Audit Your Team’s Review Responses for Quality and Consistency (previous post)
- How to Report Google Business Profile Calls, Clicks, and Directions to Clients (next in series)
- How to Manage Google Reviews From Multiple Locations in One Dashboard
- How to Identify Repeated Customer Complaints Across Multiple Store Locations
- How to Create White-Label Local SEO Reports for Your Agency Clients
- How to Track Review Response Rate and Response Time Across Your Locations
- Best Google Business Profile Management Software for Small Businesses in 2026
External links (sources referenced in this article):
- AgencyAnalytics — Multi-Location Marketing Reporting: The Official Guide: https://agencyanalytics.com/blog/multi-location-reporting
- Ignite Visibility — The Top 5 Multi-Location Marketing Blindspots (2026): https://ignitevisibility.com/wp-content/uploads/2026/09/The-Top-5-Multi-Location-Marketing-Blindspots.pdf
- Sked Social — Multi-location social media reporting: how to measure and compare every store in 2026: https://skedsocial.com/blog/multi-location-social-media-reporting
- Fuel Online — Map Views vs Calls: Comparing Locations Fairly: https://fuelonline.com/seo/map-views-versus-calls-by-location/
- Invoca — Google Business Profile Leads Outperform Paid: 2026 Benchmarks: https://www.invoca.com/blog/google-business-profile-leads-outperform-paid
- Web Tonic — 88+ Statistics Shaping Attribution & BI in the Franchise Industry (2026): https://www.webtonic.io/blog/franchise-attribution-statistics
- PromoRepublic — Insights into Location Performance: https://help.promorepublic.com/en/articles/9311348-insights-into-location-performance
- Rallio / MarTech Series — Rallio Expands With New Revenue Intelligence Capabilities: https://martechseries.com/content/rallio-ignite-visibilitys-ai-powered-marketing-platform-expands-with-new-revenue-intelligence-capabilities/
- AdMax Local / MarTech Series — AI-Powered Intelligence Layer in Franchise Management Portal: https://martechseries.com/predictive-ai/ai-platforms-machine-learning/admax-local-unveils-ai-powered-intelligence-layer-in-its-franchise-management-portal/
- Guideflow — 8 best multi-location marketing tools for 2026: https://www.guideflow.com
- Northbeam — Design your dashboard (multi-dashboard setup): https://docs.northbeam.io
- BigGeo / TMCnet — Audience Composer: Build Digital Audiences from Real-World Visits: https://www.tmcnet.com
- RevenueCloudFX / WebFX — Multi-Location Business Attribution: https://www.webfx.com
- Triadex — Closed-Loop Attribution & ROAS Reporting: https://triadexservices.com
How to Report Google Business Profile Calls, Clicks, and Directions to Clients
Grow Your Google Maps Ranking on Autopilot
Stop spending hours every week manually replying to customer reviews and writing Google posts. Busirank automates your Google Business Profile to boost your local SEO rankings and turn searchers into paying clients.

 Busirank Team